archi-intelligence Research Series · Deep Dive 2026-08
The Driver Exits: Why Autonomous Driving Will Change Everything for the Auto Industry
Data as of July 23, 2026 · Incorporates the Tesla Q2 2026 Update (July 22)
Contents
Abstract
By mid-2026, autonomous driving has crossed its commercial tipping point. Waymo has entered early scale-up on a ride curve that doubled within a year to roughly 500,000 paid trips per week, with safety performance now underwritten by reinsurance-grade actuarial data. Tesla has lit up seven metro markets and holds an option of a different kind — a million-plus FSD subscription base — while its home-market unsupervised fleet of just seventeen vehicles measures the strike price that option has not yet paid. This article maps the moment back onto our research series’ own coordinate system: the essence of driverless operation is the removal of the human driver — the most underrated component in the history of automotive engineering — from the system’s fallback position, forcing a crossing of the failure-philosophy watershed we marked in D1 §3.3. Fail-operational thereby turns from an engineering option into a condition of entry; the proof obligation (the safety case) becomes a first-order performance metric; and every rewrite of the industry’s value function downstream follows from that crossing.
The article unfolds along that spine: the traditional OEM’s “Android moment,” the hidden architecture thresholds behind the four exits, and an endgame matrix built on D2 scores (Chapter 3, with the “Cards and the Table” chart); the rewrite of the business formula from selling machines to selling miles, and the three borders around joint ventures’ “borrowed table” (Chapter 4); the repricing of R&D disciplines and individual engineers (Chapter 5); and where money flows across seven links of the value chain (Chapter 6). The conclusion delivers three judgments and one warning, and — as the Writing series requires — attaches five verifiable revision triggers. Methodologically, the article takes its discipline from a nine-year audit of ARK Invest’s 2017 report, and holds to it throughout: call directions, give ranges for time, and flag uncertainty on magnitudes.
A Note on Genre
This article belongs to the Deep Dive track, not the Working Paper track. The dividing line is not length but level of commitment:
- Working Papers (D1–D4, Zenodo DOIs) = locked claims. Never silently revised; built to survive five years of citation.
- Deep Dives (this track) = disciplined observations. Revisable, refutable, explicitly labeled “this is what we see right now,” outside the DOI system.
This article inherits the Working Papers’ epistemic discipline — source tiering, traceable evidence, mandatory counter-arguments and failure modes — but not their finality. It does not revise any published conclusion of D1–D4; wherever established judgments are cited, the published versions govern. Its conclusions carry their own revision triggers (Chapter 7); if any trigger fires, a revised edition will be published with changes marked.
1. Calling the Tipping Point: where we actually are in mid-2026
1.1 One July, two kinds of expansion
On July 21, 2026 — the eve of Tesla’s Q2 earnings — the official @robotaxi account announced unsupervised paid rides in Orlando and Tampa, the third and fourth new markets Tesla had lit up within a month. Two weeks earlier, on July 8, Waymo had announced expansion into San Diego, Las Vegas, Tampa, and Denver — at a point when it was already delivering roughly half a million paid trips every week.
On the surface these are two pages of the same story: autonomy is expanding; the horn has sounded. Put the numbers side by side, however, and you find the two companies are not expanding the same thing at all.
Waymo is expanding a fleet: three thousand-plus vehicles, nearly three hundred net additions a month, an order curve doubling every year. Tesla is expanding a map: beneath seven live markets, third-party tracking puts its unsupervised vehicles across three Texas cities at roughly twenty-one — and in Austin, its home market with the deepest data and the largest service area, seventeen, after a full year of operation.
Opening a new city costs a geofence setting and a tweet; making a city’s fleet thick is the expensive part. These two July headlines, side by side, are the most honest aperture onto the whole upheaval: the tipping point has indeed arrived — but not the way most people imagined.
Let us define “tipping point” strictly. “True driverlessness,” in industry terms, is not a test vehicle occasionally shedding its safety operator; it is four things holding at once: no continuous human supervision within a defined operational design domain; safety at a level third parties can verify rather than vendors merely assert; deployment at scale at bearable cost; and sustained replication across cities, vehicle types, and seasons. Measured against those four criteria in mid-2026: the first two are satisfied within bounded domains, the third is being tested, and the fourth is every player’s main battlefield. Hence the precise meaning of the tipping point — the question has switched from “whether it can be done” to “how fast, at what cost, and where.”
And Waymo and Tesla must be examined separately — not out of fairness, but because the two routes strike the auto industry through entirely different channels. The first attacks who owns the capacity and the customer; the second attacks whether a car, once sold, is still a finished product. Blend them and the conclusions hold for neither.
1.2 Waymo: when a reinsurer starts pricing a driver
The most consequential event on Waymo’s curve is not any city launch. It is an insurance study.
Facts first. As of Q1 2026, Waymo delivers roughly 500,000 paid trips per week — double a year earlier; its fleet, per the December 2025 NHTSA filing, stood at 3,067 vehicles; commercial operations span roughly ten U.S. metro areas, with London and Tokyo in progress. In February 2026 it closed a $16 billion round at a $126 billion post-money valuation — the largest single financing in autonomous-driving history. Co-CEO Tekedra Mawakana has set a year-end target of one million trips per week; the independent forecaster FutureSearch is cooler: on the current fleet ramp, a Q4 median of about 775,000, with a ceiling near 840,000. Even at the discounted independent number, this is a commercial capacity curve compounding at “double per year.” It is no longer a demo.
But what truly changed the nature of the game is Swiss Re. One of the world’s largest reinsurers took its own baseline — half a million liability claims across two hundred billion miles of human driving — and audited Waymo’s liability record over 25.3 million fully driverless miles. The result: property-damage claims 88% lower, bodily-injury claims 92% lower. Swap the baseline for newer human-driven vehicles (2018 onward, equipped with AEB and lane keeping) and the two figures still stand at 86% and 90%.
The weight of those numbers is not in the percentages. It is in who is doing the judging. For nine years, “our system is safe” was a vendor’s claim, a regulator’s question, a media argument. Now a company that lives by actuarial science is willing to issue a risk profile for this “driver” using its own data and methods — safety has gone from an engineering slogan to a rate that can be written into a policy. For an industry preparing to absorb a trillion-dollar mobility market, there is no harder coming-of-age than the financial system starting to price you.
The ledger must be kept on both sides, though. Also in mid-2026, Waymo’s freeway passenger service was paused pending a software update (surface streets unaffected) — scaling is not uniform, and engineering constraints can brake it at any time. Its bottleneck, by consensus, has moved from algorithms to two clumsier things: vehicle supply and depot operations. On the supply side, two threads are worth noting. Ojai — the first vehicle designed from scratch for driverless operation (contract-built by Zeekr, carrying the sixth-generation Waymo Driver) — is independently forecast to take its first paid ride around October 2026. And per a February 2026 Gasgoo report, widely relayed, Hyundai is in talks to supply Waymo with 50,000 IONIQ 5s through 2028 (~$2.5 billion, built in Georgia) — as of this writing the order remains unconfirmed and is treated as report-grade talks. What is nailed down: the October 2024 multi-year Hyundai–Waymo strategic partnership, and the April 29, 2025 preliminary agreement between Waymo and Toyota to bring Waymo’s technology to next-generation personally owned vehicles — the latter confirmed, at a March 2026 Tokyo event, to have entered substantive co-development.
Hold on to those two supply-side threads. One leads to building cars for Waymo; the other to putting Waymo inside your own cars. Contract manufacturer; technology licensee — the legacy OEM’s two role archetypes on this route now have names and faces. Chapter 3 begins there.
1.3 Tesla: an option, and its pricing problem
Tesla’s story must be read as two sets of numbers in parallel, because either set alone yields the wrong conclusion.
Set one, the map: as of July 21, Robotaxi covers seven markets — Austin, Dallas, Houston, Miami, Orlando, and Tampa unsupervised; the Bay Area still with a safety driver under California rules. From the June 2025 Austin start: six new cities in a year. Set two, the fleet: at the same moment, roughly 21 unsupervised vehicles across the three Texas cities, with the newly launched cities’ fleets undisclosed. A map lighting up fast; a fleet standing still.
That contrast received an official quantification in the Q2 report published on the evening of July 22: cumulative paid Robotaxi miles of roughly 2.4 million (chart reading, through June 2026). For scale — at Waymo’s ~500,000 weekly trips of several miles each, the rival’s paid mileage runs to millions of miles per week; one year of Tesla Robotaxi operation roughly equals one week of Waymo (inference-grade order-of-magnitude comparison). The same report offered two new threads on fleet-thickening: the Cybercab, designed from scratch for driverless service, has entered production at Gigafactory Texas (installed capacity above 125,000 units a year), with employee shuttles on the factory campus from July; and on the service map, Phoenix and Las Vegas are marked “preparations underway” — the latter also appearing on Waymo’s July 8 expansion list. For the first time, the two routes will meet head-on in the same city.
Musk himself supplied the explanation on the Q1 earnings call: the constraint is “rigorous validation to ensure complete safety,” and Robotaxi revenue will “not be a meaningful contributor” in 2026, with substance expected from 2027.
This article’s characterization of the contrast (inference-grade, stated openly): today’s Tesla Robotaxi is an option on display, not a capacity. Note that this is not pejorative — the option itself may be enormously valuable. Tesla’s real stake was never those twenty-odd cars; it is the installed base: as of Q2 2026, roughly 1.48 million active FSD (Supervised) subscriptions (up 56% year over year, with an attach rate above 55% of new North American deliveries) and over 11 billion cumulative FSD miles (Q2 chart reading). The moment an unsupervised build clears validation and is pushed to the consumer fleet, marginal expansion cost approaches zero — every new Waymo city means vehicles, depots, and an operations team; Tesla, in principle, needs one OTA. That is something the heavy-asset model can structurally never do.
Everything hangs on that “the moment.” What stands between Supervised and Unsupervised goes by many names — validation, approval, safety case. This article uses one: the proof obligation. It is the option’s strike price, and no one knows the exact figure. We know only a lower-bound measurement: a company famous for aggression, in the city where its data runs deepest, took a full year to reach seventeen unsupervised cars.
1.4 Auditing a nine-year-old ledger: ARK 2017
In October 2017, ARK Invest published Mobility-As-A-Service: Why Self-Driving Cars Could Change Everything — the most systematic, and most aggressive, autonomy forecast of its day. Reopening it nine years later is not mockery. Quite the opposite: its hit rate on direction is startling, and where it missed, the miss is enormously informative.
Score it on three axes: direction, time, magnitude.
Direction: nearly all hits. ARK’s chain of logic — utilization economics (4–5% for private cars vs. 50%+ for fleets) collapsing cost per mile; value shifting from hardware to services (a service market roughly ten times the hardware market); fleet mileage data forming regional monopolies; teleoperation as the edge-case backstop; first movers winning geographies — all five clauses have been vindicated by 2026. Waymo’s remote-assistance centers, city-by-city expansion, and the “miles → safety → permits and insurance → faster expansion” flywheel run almost to ARK’s script.
Time: systematically six to seven years early. ARK called commercial deployment for 2019 and robotaxis as the dominant mode of door-to-door mobility by the late 2020s. Reality: Waymo removed safety drivers in Phoenix only in 2020, and entered early commercial scale in 2024–2026; “dominant mode” remains distant in 2026.
Magnitude: off by an order. ARK called $0.35 per mile by 2020; reality is a median Waymo fare around $17.25 per ride in the Bay Area at end-2025 (Obi pricing study) — even allowing for fare-vs-cost differences, that is an order of magnitude away. ARK called developed-market auto sales halving by the late 2020s; it has not happened.
The interesting part is asking what exactly ARK got wrong. It did not underestimate the technology — Google’s cars could drive in 2017. It underestimated the distance from “can drive” to “provably safe, insurably operable, replicably scalable.” That distance ate the six or seven years, and it has a name: the proof obligation, again. The error term in ARK’s timeline is precisely the subject of Chapter 2.
The audit also sets three rules this article obeys throughout: call directions; give ranges for time; flag uncertainty on magnitudes. We do not intend to be audited in 2035 the way we have just audited ARK.
1.5 Three clocks
Finally, honesty requires a note: this tipping point does not arrive uniformly. Three major markets run on three clocks. (This section is inference-grade synthesis.)
The United States ticks loudest: top-tier cities enter substantive substitution of taxis, ride-hailing, and part of private-car mileage in 2026–2028; state-by-state regulation, fragmentary as it is, gives first movers room to negotiate city by city. China may run faster, on a different dial: robotaxi operations by Apollo Go, Pony.ai, and WeRide, layered on the mass-production NOA arms race among domestic OEMs and the Huawei / Momenta / Horizon ecosystems, point to an endgame of alliance blocs rather than “Waymo-ization” — the production data loop sits with OEM-plus-supplier coalitions, not a single operator. (This section names operators qualitatively and makes no quantitative claims.) Europe likely lags three to five years: the EU’s L4 type-approval framework is still in the making, and city structure plus labor conditions slow substitution further (note the separate approval tracks: Tesla’s FSD (Supervised) has been approved in the Netherlands, Lithuania, Estonia, Denmark, and Belgium, with over 50 million kilometers driven — but that is the L2 supervised track, and does not alter the L4 lag). One thing must be said plainly to European OEMs: lag is a buffer, not a moat. Whoever enters when Europe’s framework matures will be a mature ecosystem that completed its data flywheel and cost decline in America and China. The buffer’s only value is time to turn — and the window is narrower than most boardroom slides draw it.
Two routes, three clocks — one shared technical fact: whether Waymo’s operating network or Tesla’s installed-base generalization, the premise is removing the human driver from the system’s fallback position. Which is exactly the watershed we marked in prior research — the fundamental divide between fail-soft and fail-operational — being crossed under compulsion. The driver has left; the fallback has not vanished. It has become a contract that must be co-signed by machines and evidence.
What that contract is called, how much it weighs, and who carries it — next chapter.
2. The Watershed: the contract the driver left behind
2.1 The most underrated component in automotive history
The entire safety philosophy of a century of automotive engineering rests on a component that never appears on a BOM: the person in the driver’s seat.
Seen from systems engineering, the human driver is a near-miraculous part. It is free — zero material cost. It is adaptive — it handles scenarios no designer anticipated. It is legally accountable — when an accident happens, the chain of liability has a natural endpoint. Because that component exists, the car could park its failure philosophy in a relatively comfortable spot: when something breaks, degrade, then hand back to the human. Brake booster fails — the human can still stamp the pedal. Power steering fails — the human can still wrench the wheel. ADAS can’t read the scene — a chime, and the human takes over. In engineering terms this is fail-safe: on failure, enter a safe state — and the definition of “safe state” always quietly contained a person who could take the handoff.
D1 §3.3 drew the fundamental line between consumer electronics and automobiles at failure philosophy: phones and the internet are fail-soft — failure allowed, redundancy as backstop, cost paid in degraded experience; cars and robots demand fail-safe / fail-operational — failures must be managed, liability attributable, the cost being physical harm. There we stressed the wall between two industries. What this article adds is a layer inside the wall: through the century of “a driver present,” the automobile stood on the gentler side of that watershed. Fail-safe sufficed because the human fallback was always on duty.
What driverless technology does can be said in one sentence: it removes that component from the system.
Then everything changes. A failing L4 system has no one to hand back to — a Robotaxi running empty on a highway at 2 a.m. has nobody behind the wheel, perhaps no wheel at all. The system cannot stop at “enter a safe state and wait for a human.” It must keep operating through the failure and bring the vehicle to a minimal risk condition on its own: change lanes safely, decelerate, pull over, stop, light up, call remote assistance. That is fail-operational — not “safe after failure” but “still in service through failure.”
In the world with drivers, fail-operational was a luxury option, a phrase engineers used to argue for budget in safety reviews. In the world without them, it is the condition of entry. This is not a technology upgrade. It is a generational change of failure philosophy — and the entire rewrite of the industry’s value function begins with that change.
2.2 The terms: what the machine’s fallback looks like
The driver has left; the fallback has not disappeared. It has become a contract, with terms roughly as follows.
Full-path redundancy. Braking, steering, power supply, communications — every path to the physical world needs a second one. Not “backup sensors” as local redundancy, but vehicle-level fail-operational design across sensing, compute, actuation, and energy: primary brakes fail — redundant braking must take over within a closed time window; primary power fails — safety-critical loads must switch seamlessly. ASIL-D stops being a rating decomposed onto a few functions and becomes a design constraint running the length of the fail-degraded path — which failure combinations drop the system to which capability level, which maneuvers each level permits, how many seconds to the minimal risk condition: all fixed at design time, all exhaustively verified.
Functional safety thereby completes an identity leap: from compliance item to first-order performance metric. For a fleet vehicle, “cost per mile” and “provable safety” are the only two lines on the invoice; steering feel and exhaust note are not billable.
The contract is even being etched into silicon. In Deep Dive 2026-07 we verified a spec detail on Qualcomm’s Dragonwing IQ10: the chip carrying System-2 reasoning — the “brain” running large VLA models — ships with SIL3 lockstep CPUs, a safety island, ECC memory, and a Safe RTOS. Consumer-electronics economics would dictate the cheap layout: phone-grade AI SoC up top, safety mechanisms quarantined into small end-point MCUs — brain fail-soft, spine fail-operational. Qualcomm did not do that. The proof obligation has penetrated the reasoning layer: even the chip that “thinks” must be lockstep-capable and auditable. The watershed is no longer a line in a paper; it is a row in a chip’s spec sheet.
The contract’s operating discipline had a live demonstration in mid-2026: Waymo paused its entire freeway passenger service pending one software update, surface streets running as usual. In consumer electronics the move is unintelligible — who halts a product line for a patch? In the fail-operational world it is the contract executed to the letter — D1 §3.3 stated the iron rule: updated behavior must not break the verified safety envelope. Until verification closes the loop, stand still. That is not conservatism; it is how this species breathes.
2.3 The proof obligation: an engineering discipline being born
A contract with terms still needs someone to prove the terms are met. The engineering weight of that task is what the whole industry — 2017’s ARK included — collectively underestimated.
The hard part of L4 was never making the car drive. Google’s cars drove in 2017. The hard part is proving: under what conditions it is safe; how it degrades when it is not; how it reaches minimal risk under fault; whether an update introduced new risk; how one covers scenario combinations at one-in-ten-million odds; how one argues the behavior of an end-to-end network; where remote assistance’s boundary lies; what happens under attack.
The toolbox for those questions is nearly a different species from legacy automotive validation. Requirements tests, rigs, proving grounds, road testing remain — but the real weight presses on the new side: SOTIF (ISO 21448) for “nothing broke, still dangerous”; UL 4600 for the structure of the vehicle-level safety case; scenario libraries and mass simulation absorbing the combinatorial explosion physical miles can never cover; shadow mode turning the installed base into a free control experiment; data reflow, version rollback, and online monitoring turning “release” from a date into a lifelong pipeline. This article’s judgment (inference-grade): within L4’s R&D workload, validation and safety argumentation likely exceed half — possibly much more. It births a discipline that did not exist: its practitioners are not the people who write the code, but the people who prove the system is safe enough. The more regulation matures, the more expensive they get.
And the discipline’s ultimate addressee may surprise most engineers: not the regulator — the actuary. Regulators grant entry; insurers set the price. Chapter 1’s Swiss Re study closes its loop here: when a reinsurer will issue a risk profile for an autonomous system against two hundred billion miles of exposure data, the safety case stops being a stack of documents for an approval office and becomes a monetizable asset — lower claims convert directly into lower operating cost and faster city entry. A proof obligation done well pays book returns.
Done incompletely, it also has a price. Tesla spent a year in its data-richest city to field seventeen unsupervised cars — Chapter 1 called that the option’s strike-price floor. Now the sentence can be finished: that strike price is the signing cost of this chapter’s contract. Every dollar the vision-only stack saved on sensors converted, without discount, into time spent on argumentation.
2.4 Re-dealing the cards: how the watershed prices the OEM’s hand
D1 §3.7 issued a verdict on the architecture landscape of the embodied-AI era: infrastructure converges; control semantics and proof obligations diverge. Compute, Ethernet backbones, virtualization, world models, OTA pipelines — the first layer gets absorbed by SoC vendors, cloud platforms, and open ecosystems. Physical control, safety shells and failure management, liability proof and auditability, regulatory fit — the second layer keeps diverging and, under strengthening regulation, hardens in the hands of domain players.
Point that verdict at autonomous driving and a fact usually drowned by the doom narrative surfaces: the second layer is precisely the legacy OEM’s home ground.
Waymo will write the best Driver on the planet. But Waymo will not — today, at least — build a redundant by-wire vehicle that passes ECE type approval, holds its cost, and runs down a production line. Fail-operational braking and steering, vehicle-level fault isolation and degradation, manufacturing consistency at the scale of hundreds of thousands, certification engineering across dozens of markets — those capabilities live in the skeleton of the OEM and Tier-1 system, and cannot be bought with funding rounds or assembled by recruiting. That is why the Toyota agreement and the Hyundai talks exist: Driver ecosystems need the second layer, and the second layer needs people who build cars.
It is the largest technical chip in the legacy OEM’s hand — and possibly the last.
Its shelf life must be recorded in the same breath. Waymo’s Ojai has already demonstrated an AV company’s ability to define a vehicle in reverse — no-driver packaging logic, native sensor integration, fleet-maintenance-first design, the spec written by the operator. Today Ojai still needs Zeekr to build it; but once “who defines” and “who manufactures” split, the manufacturing side’s leverage starts a countdown. This article’s judgment (inference-grade): the chip’s shelf life is about five years. Within five years an OEM can choose to make its fail-operational platform something Driver ecosystems cannot do without — climbing from the contract seat to platform partner. After five, the seating order will most likely be set.
The cards have been repriced. Next chapter: how to play them — four exits, four endgames — and this time we place the names from D1 and D2 directly into the matrix.
3. The Android Moment: legacy OEMs at the table
3.1 The deadliest loss isn’t volume — it’s the customer relationship
Start with the specimen that already has a name.
Per reports, Hyundai is negotiating to supply Waymo with 50,000 IONIQ 5s through 2028 — roughly $2.5 billion, built at the Georgia Metaplant, integrated to Waymo’s spec (unconfirmed as of this writing; see Chapter 1). If it lands, it will be the largest single vehicle order in autonomous-driving history. On Hyundai’s sales report, a handsome deal. Unpack the transaction structure: the car is built to the other side’s spec; the end customer is Waymo, not a rider; the badge appears on the door panel but not in the passenger’s phone; software revenue, zero; operating data retained, none. The role those 50,000 vehicles play has an old name from consumer electronics — contract manufacturer.
Foxconn builds the iPhone; the overwhelming share of profit goes to Apple. Everyone in the car business has read that script. They just never imagined being cast as Foxconn.
That is what this chapter’s “Android moment” means. The three assets legacy OEMs spent a century accumulating — brand, channel, customer relationship — devalue simultaneously in mobility-as-a-service, and in the most uncomfortable way: not breached, but bypassed. The rider opens Waymo’s app and doesn’t glance at the badge — the way nobody chooses Lufthansa over the airline next door because the plane is an Airbus rather than a Boeing. Aircraft manufacturing is a fine business, but it is a B2B manufacturing business — margins, leverage, and brand premium all sit one full tier away from the airlines that own the traveler. The auto industry is being pushed into the same structure: for the first time, the people who build the cars and the people who own the mobility customer can be different people.
A moat bypassed rather than breached is the hardest kind of loss to defend — all your fortifications face forward.
3.2 Demand side: totals overstated, structure understated
The popular doomsday arithmetic runs: one robotaxi replaces 8–10 private cars, therefore total demand collapses. The sum is missing half its terms. Private-car utilization is ~5%; a fleet can exceed 50%; the substitution ratio is real. But high utilization also means annual mileage jumping from ~15,000 km to over 100,000, and scrappage cycles compressing from 12–15 years to 3–4 — the fleet’s high-frequency replacement partly offsets the decline in the parc. The volume ledger is far less catastrophic than the narrative paints.
What should actually keep boards awake are three structural shifts.
First, product-definition power moves. Fleet buyers order on total cost per kilometer and uptime, and pay nothing for emotional value. Waymo’s Ojai is the first vehicle designed from zero for driverless operation — packaging logic without a driver’s seat, easy-clean interiors, native sensor integration, fleet-maintenance-first engineering — the spec written by the operator, the OEM executing. Chapter 2 covered what that does to manufacturing leverage; add one line here: when the pen that writes the spec changes hands, so does the definition of “product excellence.”
Second, the market stratifies — and the fire concentrates on volume. Private ownership won’t vanish: suburban and rural use, driving pleasure, identity, the luxury tier all remain. Porsche’s logic is barely touched. What sits fully exposed in the substitution kill zone is the urban commuter model of the volume brands — precisely the mass-market OEM’s bread-and-butter segment. The impact is not spread evenly across the industry; it lands, precisely, on the thickest page of the P&L.
Third, the residual-value system shakes. Robotaxis depress urban used-car demand and the residuals of ride-hailing stock — and residual models are the foundation of captive finance and leasing, which in many OEMs out-earn the vehicles themselves. Volume decline is a slow variable; finance repricing residual expectations is a fast one. Capital markets will vote before consumers do.
3.3 Four exits, and a hidden prerequisites table
The full-stack self-build route has been half-falsified by burnt cash: GM shut Cruise after cumulative spending above $10 billion; Ford and VW dissolved Argo earlier. The lesson is not “L4 can’t be done” — Waymo did it — but that an OEM’s capital structure, iteration speed, and talent density cannot carry this game. Four realistic exits remain, all much discussed. What this article adds is a table nobody puts on the desk: the four exits demand entirely different levels of architecture maturity — where you stand on the AR ladder decides which exits actually exist for you.
Exit A: license in (the Toyota pattern). Put an external Driver into your own vehicle; keep the car and the brand. It sounds like the dignified compromise, but it carries a widely underestimated technical threshold: hosting an L4 Driver requires a highly centralized, hardware-software-decoupled, compute-rich platform — in D2’s five-dimension language, D1/D2/D5 must be strong. A Driver is not an ECU; it is a guest that requires the vehicle to restructure itself around its interfaces. D2’s snapshot grade for Toyota is AR2 (14/25) — meaning that when the April 2025 agreement was signed, what separated the parties was not only commercial terms but at least a level and a half of architectural climbing. The licensing route’s cruelty: after handing over the most differentiating layer, it still requires you to renovate the platform to receive the guest.
Exit B: hardware platform supplier (the Hyundai pattern). Proactively become the fleet market’s Tier 0.5. Of the four exits this demands the least architecture maturity — what it wants is not an AR3 intelligence platform but Chapter 2’s hardware clauses: fail-operational braking, steering, power; extreme cost; manufacturing consistency. Which resolves an apparent paradox: why AR1.5-rated Hyundai, of all firms, holds the largest order talks in history. The contract seat is not graded on architectural intelligence; it is graded on redundant chassis and Georgia’s line discipline — exactly what the legacy manufacturing system still grips. Thin margins; but the thresholds are ones it knows.
Exit C: run the operation yourself. Buy or partner for the stack, build fleet and ops, keep the customer interface. Enormous capex, and OEMs lack the operating gene — the requirement approximates AR4 plus an internet company’s ops team; the qualifying names worldwide fit on one hand, and few are called legacy OEMs. The likelier form is a JV: OEM + city + mobility platform.
Exit D: hold private ownership + incremental L2++/L3. Bet on slow substitution, on European regulation, on ownership habit. Mercedes’ UN-R157 L3 certification is this route’s best version — D2’s D4 dimension gave it the assessment’s only 5. But honesty requires: for most who choose it, Exit D is not a decision. It is the absence of one.
The realistic answer is almost inevitably a portfolio: different brands, regions, and dates on different routes. The real strategic question is single: in which market, which segment, at what date, do you switch from D to A/B/C. Switch early, burn money; switch late, exit the game. And Chapter 2 already gave the window an inference-grade shelf life: about five years.
3.4 The endgame matrix: putting D2’s names in it
D2 photographed 22 OEMs across five dimensions in January 2026. Now slide that photograph under the endgame projection — four terminal states, each with candidates traceable to the scoresheet. (The mapping is inference-grade: the AR grades are our published measurements; the endgame assignments are this article’s forward projection on top of them. The two carry different confidence levels.)
Chart first, then table.
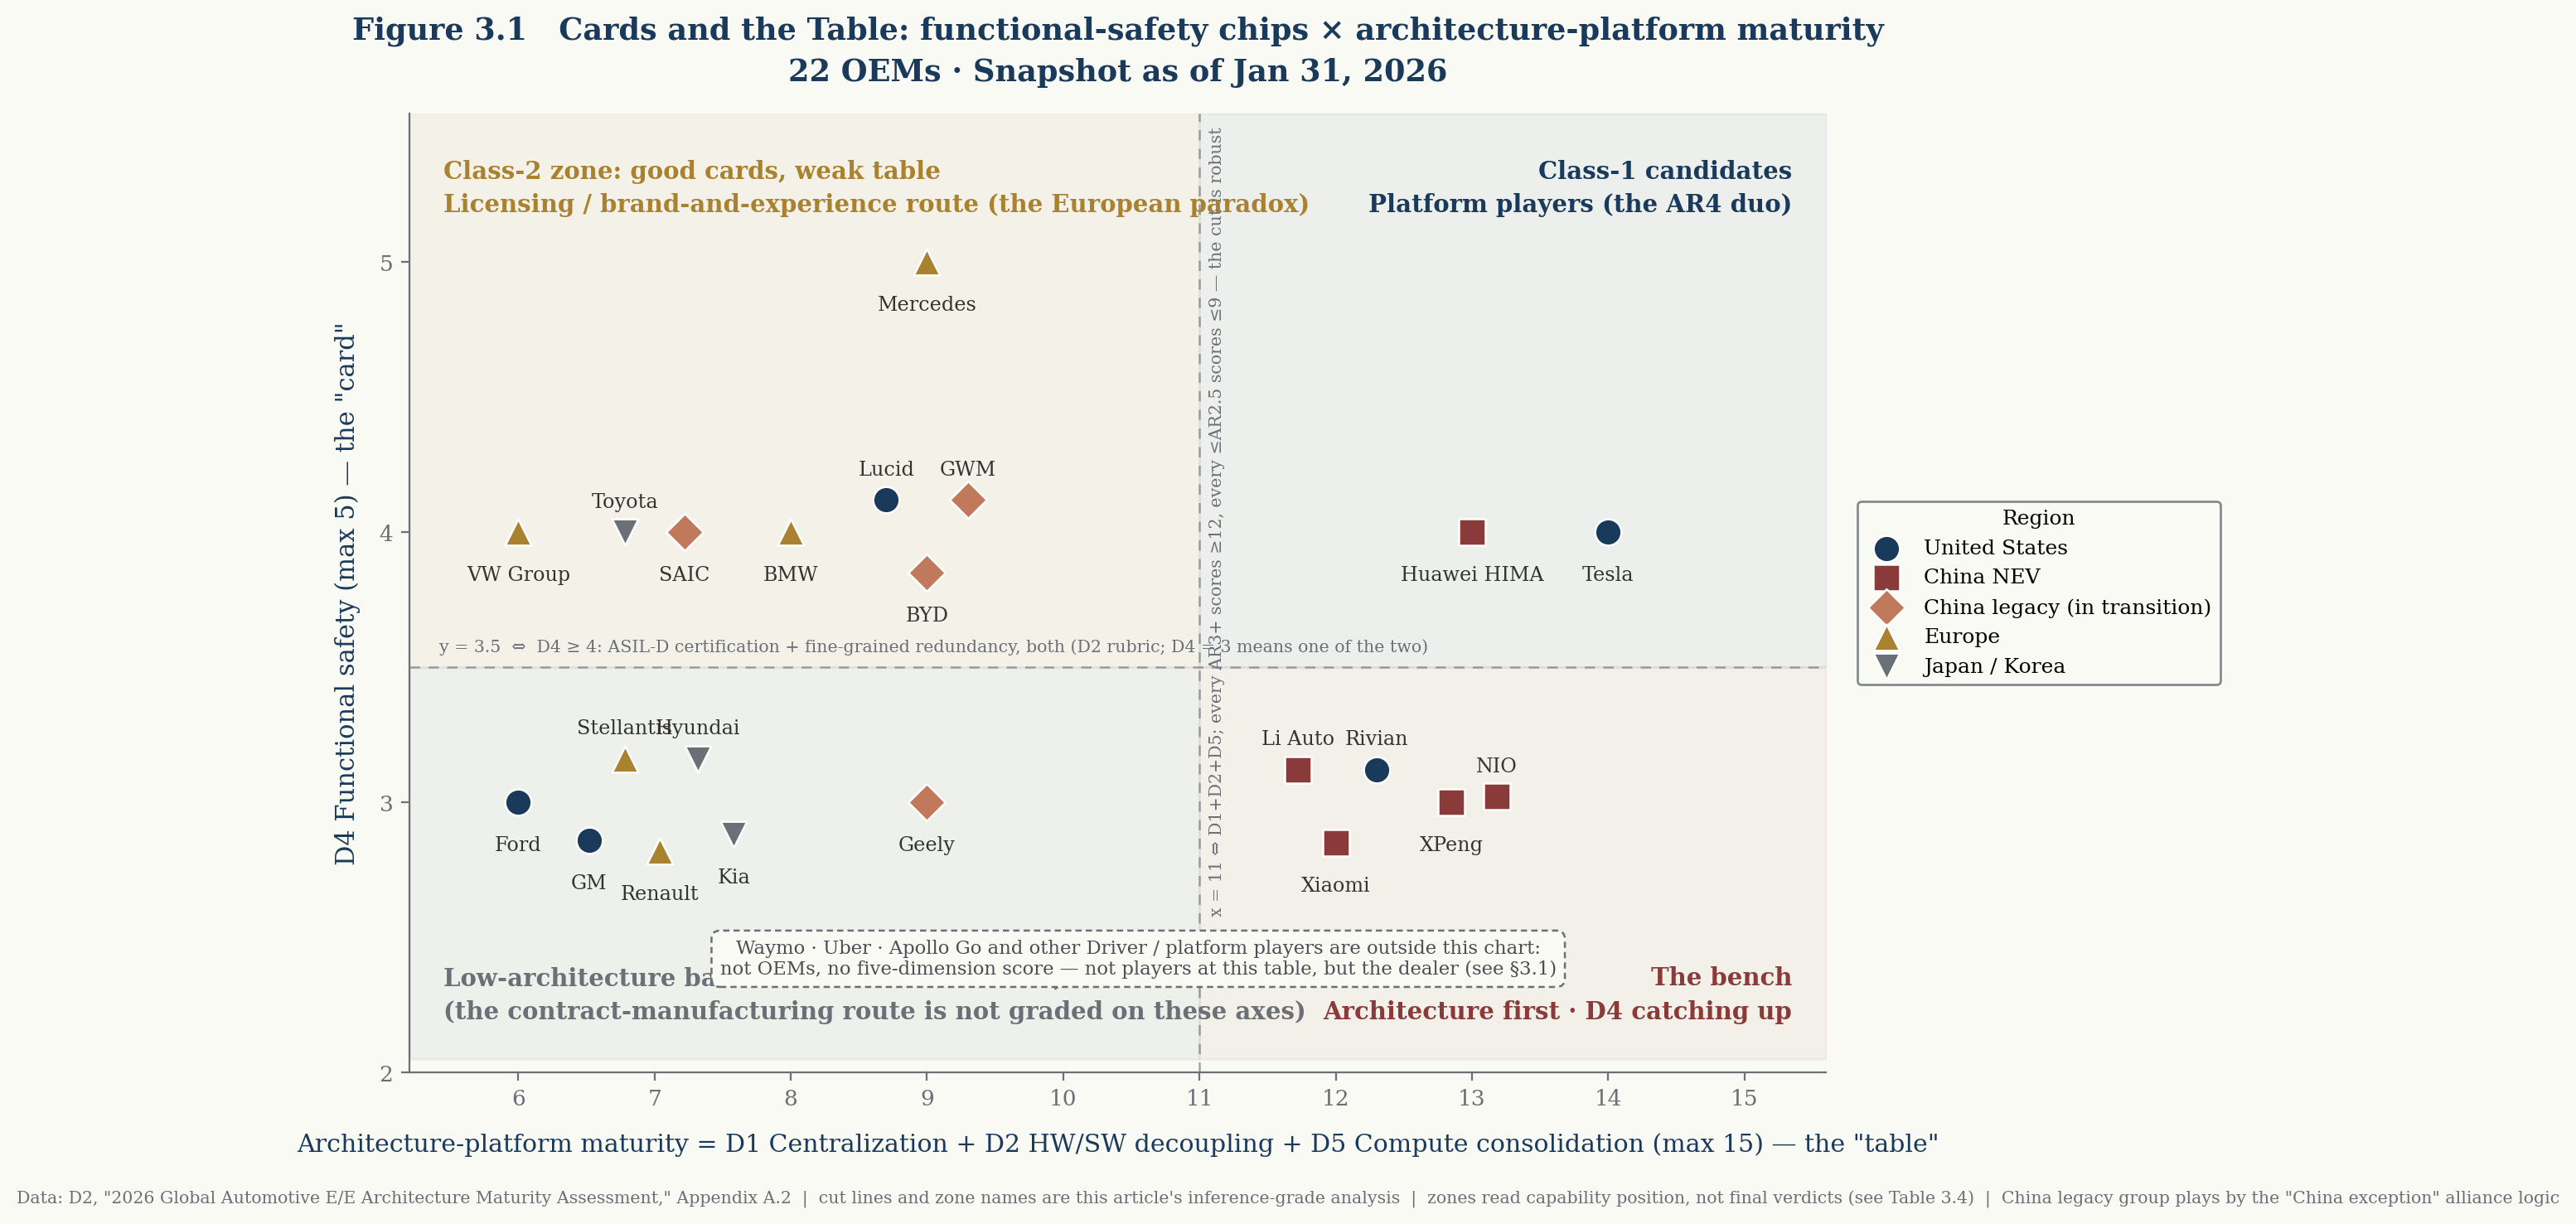
Figure 3.1 — Cards and the Table. X-axis: the sum of D2’s D1 Centralization + D2 HW/SW decoupling + D5 Compute consolidation (the “table” — the platform needed to host or run an L4 Driver); Y-axis: D4 Functional safety (the “card” — Chapter 2’s fail-operational and proof-obligation chip). Data from D2 Appendix A.2. Cut criteria (reproducible): the horizontal line y=3.5 means D4≥4 — by D2’s published rubric, D4=4 is ASIL-D certification plus fine-grained redundancy, both; D4=3 is one of the two. The vertical line x=11 falls in a natural gap in the data — every AR3-and-above sums ≥12 on the three dimensions, every AR2.5-and-below sums ≤9, so any cut between 9 and 12 yields the same partition. Both lines are projections of D2’s locked scores; only the four zone names are this article’s inference-grade analysis. Zones read capability position, not final verdicts: a zone states the necessary condition of entry; endgame assignment (Table 3.4) further weighs strategy, alliances, and orders — VW sits in the Class-2 zone with the zone’s lowest x, showing how widely realization capacity varies within one zone; Geely and BYD sit in different zones on a single variable (D4: 3, one-of-two, vs. 4, both) drawn from D2’s locked rubric, not invented here — and Geely’s landing in the low-architecture band cross-validates the strategic fact that Zeekr is already building the Ojai. Waymo, Uber, Apollo Go, and other Driver / platform players are outside this coordinate system: not OEMs, holding no five-dimension score — not players at this table, but the dealer. The China legacy group (BYD, Geely, GWM, SAIC) plays its real game by the “China exception” alliance logic in Table 3.4; the chart shows only their five-dimension readings.
| Endgame | Traits | Closest candidates from D2’s list | Architecture bar |
|---|---|---|---|
| Class 1: Platform players | Own or deeply control the Driver stack + unified software and E/E architecture + data loop; run both private and fleet markets | Tesla (AR4), Huawei HIMA (AR4) — D2’s “AR4 duo”; the bench: the Chinese NEV four sprinting to AR4 on Roadmap (XPeng, NIO, Li Auto, Xiaomi) | AR4 to start |
| Class 2: Brand & experience players | Don’t own a Driver, but hold luxury brands, cabin, safety engineering, and loyal segments; buy platform capability — the PC-brand position vs. Windows/Intel | Mercedes (AR2.5; the only D4 = 5), BMW (AR2), Toyota (AR2, plus the Waymo agreement) | AR2.5–3 (platform must be renovated to host an external Driver) |
| Class 3: Specialist manufacturers | Supply robotaxi vehicles, dedicated chassis, and maintenance to platforms; large volume, thin margin, B2B | Hyundai/Kia (AR1.5; order talks + Metaplant), the Geely system (AR2 — Zeekr is already building the Ojai: the only endgame of the four already on the line) | Lowest bar — graded on fail-operational hardware and manufacturing discipline |
| Class 4: Absorbed or exiting | Software platforms chronically late, multi-brand duplicated development, no data loop, supplier-black-box dependence, old and new revenue collapsing together | Not named here. But the bottom third of D2’s scoresheet, with the flattest Roadmap slopes — readers can see the rows themselves | — |
| The China exception | Alliance blocs: Driver capability held by OEM + supplier coalitions (Huawei, Momenta, Horizon systems); no single Waymo-style operator monopoly emerges | BYD, Geely, GWM and the China-legacy transition group (AR2–2.5, Roadmap broadly +1) choose sides within blocs rather than picking from the four | Bloc logic replaces single-firm logic |
Inside that matrix hides the paradox this chapter most wants to state. It concerns Europe.
Chapter 2 argued that fail-operational and the proof obligation are the legacy OEM’s biggest technical chip. D2’s data says: the chip really is in Europe’s hand — European OEMs lead the world on D4, and Mercedes holds the assessment’s only perfect L3-certified score. But the other three columns of the same scoresheet say: Europe trails comprehensively on centralization, decoupling, and compute; VW sits at AR1.5; the European mean (1.80) is below China’s legacy carmakers. D2’s verdict at the time: a moat of safety compliance cannot stop an architectural paradigm migration. Placed in this article’s frame, the sentence can be made to hurt more: Europe holds Chapter 2’s card, and lacks the table to play it on. D4 leadership buys entry tickets to Class 2 and Class 3; but to sit in Class 1 — or even to negotiate good licensing terms within Class 2 — takes D1/D2/D5, exactly where Europe’s architecture debt lives. Good card. Trembling hand.
3.5 Timing: the chapter’s only open question
Stack 3.3 on 3.4 and the legacy OEM’s strategic question collapses to one variable: the switch date.
Exits are actions; endgames are terminal states; what connects them is timing. Switch too early and you are Cruise’s ten billion; switch too late and you enter as Europe’s framework matures — to find opponents who finished their data flywheels and cost declines in America and China. Chapter 1 said it: lag is a buffer, not a moat. And the clock is not uniform: Zeekr is already building the Ojai, Hyundai’s negotiating table is set, Toyota’s co-development has moved from memorandum to engineering — the seats in Class 3 and Class 2 are being taken by those who arrive first. Every contract-manufacturing deal and licensing agreement signed narrows the negotiating room of those who come after.
Which is why this article does not treat “whether to transform” as a question — that question stopped being worth discussing in 2026. The real questions: which exits your AR grade permits; in which year your board dares press the button; and — next chapter’s subject — once pressed, where the money comes from, and where it goes.
4. From Selling Machines to Selling Miles: the great migration of the profit pool
4.1 One arithmetic problem — and capital’s answer
Start with a reconciliation. As of mid-July 2026: Volkswagen Group’s market capitalization stands near €37 billion, BMW near €35 billion, Mercedes-Benz Group near €43 billion — the German big three together around €115 billion, roughly $125–135 billion at current rates. Waymo’s post-money valuation from its February round: $126 billion.
An operator not yet profitable, running three thousand-odd vehicles, is valued at roughly the combined worth of three manufacturing giants that sell close to ten million vehicles a year and earn profits in the tens of billions of euros. That arithmetic is not this article’s opinion; it is the answer sheet capital markets have already turned in. The remaining task is to explain it: what exactly is being priced?
First, what plainly is not being priced: today’s P&L. Waymo’s books are honest — a median fare around $17.25 per Bay Area ride at end-2025 (Obi study); roughly 46% of its California mileage deadheading, comparable to ride-hailing, per independent analysis of CPUC data; Alphabet’s Other Bets segment posting a ~$5.5 billion operating loss in 2025, with independent forecasts near $8.5 billion for 2026. Even a genuine million weekly trips by year-end annualizes to only $0.9–1.0 billion at current fare levels. The new profit pool is, today, a loss pool.
Capital is pricing something else: the endgame gross-margin structure. The legacy formula is “per-vehicle margin × volume + aftersales + finance,” every term with rigid marginal cost — selling one more car means building one more car. The mileage formula is “(revenue per km − cost per km) × fleet × utilization,” where the software and operations terms decline with scale: the Driver’s R&D spreads across every mile; more cities and thicker mileage spread it thinner. ARK’s 2017 direction call — a service market roughly ten times the hardware market — bet on exactly this structural difference. Manufacturing was the source of profit in the old formula; in the new one it is a cost item. That single change of part-of-speech is the entire cipher of the value-chain reshuffle.
The new formula has exactly three value-capture points: the Driver stack (licensing and revenue share), fleet operations (utilization and uptime management), and the demand gateway (app and platform). Waymo’s June launch of a $30 monthly membership (10% ride cashback; break-even near four rides a week by Bloomberg’s math) is a textbook land-grab on the third point: enclose the high-frequency user before rivals field a fleet. Note what the three points share — not one of them is “building cars.”
And record a self-confirmation from the old formula’s most successful player: in its July 22 Q2 outlook, Tesla writes that deliveries will depend on allocation decisions between sale to customers and use for its owned and operated fleet, and that it expects hardware-related profits to be accompanied by an acceleration of AI, software, and fleet-based profits. When a company built on selling cars begins writing “sell or keep” as a resource-allocation problem, the switch between the two formulas is already happening on its own production line.
4.2 Four systems being remodeled
When the profit pool moves, the entire infrastructure built around the old pool gets remodeled with it. Four systems stand first in line.
Dealers. Fleet procurement bypasses the dealer; private-market smart-vehicle sales drift toward direct models. Sales turns from B2C’s ten million customers into B2B’s handful of large accounts; showrooms, sales forces, finance-penetration metrics lose gravity together. For European OEMs it stings twice: dealer contracts and their legal obligations make every channel reform carry litigation cost — the channel asset has become a transition liability. Dealers won’t vanish; their terminal role is delivery centers, regional repair nodes, and fleet service stations — not places that sell cars.
Insurance. The liable party shifts from driver to system provider; motor insurance mutates from a B2C actuarial business into B2B product liability — not a gradual shift, a change of species. Swiss Re, present in Chapters 1 and 2, makes its third appearance here: a reinsurer embedded in Waymo’s safety-data evaluation is not indulging academic curiosity; it is pre-positioning for pricing power over a new line of insurance. The practical implication for OEMs, said plainly: when you install someone else’s Driver, how the accident-liability chain is cut will be the hardest clause in the licensing negotiation — harder than the revenue split, because the split negotiates how much you earn, and the liability cut negotiates how much you pay.
Aftersales. If autonomy delivers its safety promise, the collision-repair revenue line shrinks; but a fleet running 100,000 km a year lifts tires, suspension, brakes, seats, sensor cleaning and calibration, battery cycling. The aftermarket doesn’t shrink — it changes shape: from the 4S system’s low-frequency, scattered accident repair to fleet-grade, high-frequency predictive maintenance and depot-centralized operations. Say the opportunity out loud: this is the new profit pool inside the disrupted old system that legacy OEMs are best placed to contest — fleet-grade predictive maintenance feeds on whole-vehicle understanding and parts supply chains, both of which grow on OEM and Tier-1 bones.
Energy and remote assistance. Fleet charging, cleaning and staging, remote-assistance centers form a brand-new operating layer. Chapter 1’s recorded fact finds its explanation here: Waymo’s city-by-city bottleneck is no longer the algorithm but depot siting and operational ramp. Whoever holds a city’s depot network holds the fleet’s home base — a business whose temperament is closer to infrastructure and real estate. And today it is almost unclaimed.
4.3 Flywheels and endgame concentration
This industry’s endgame is most likely highly concentrated — two or three Driver ecosystems plus regional players — because safety performance compounds with fleet mileage: more miles → more edge cases → better models → lower incident rates → easier permits and insurance → faster expansion → more miles. ARK’s 2017 “regional data monopolies” call scores another direction hit.
The flywheel spins two ways. Waymo’s turns on high-grade operating data: fully driverless, fully liable, fully recorded — every mile is safety-case ammunition. Tesla’s turns on installed-base scale: 1.48 million subscriptions, over eleven billion shadow-mode-fed miles — breadth traded for depth. Which spins faster is a question this article does not bet on. It notes only what they share: legacy OEMs have neither. No operating fleet, no first kind; no unified architecture and data loop, no second. The admission ticket to the data flywheel is precisely the two axes of Chapter 3’s chart.
The one exception is China. D2 Chapter 6 recorded the scale of Chinese OEM-bloc data loops: Li Auto around 1.2 billion km cumulative; the Huawei system around 8.76 billion km; BYD around 72 million km per day — outside Tesla, the world’s only genuine mass-production data loops. Which explains why China’s endgame is alliance blocs, not “Waymo-ization”: the flywheel is held by OEM-plus-supplier coalitions, out of any single operator’s reach. And therefore the China-legacy group’s positions on Figure 3.1 are their five-dimension readings, not their fate — inside bloc logic, a single firm’s architecture debt can be borrowed against the bloc. An option Europe does not have.
4.4 Joint ventures: the borrowed table, and its border
That last sentence — “architecture debt can be borrowed against the bloc” — invites an immediate follow-up: what about the foreign brands that exist in China as joint ventures — SAIC-VW, GAC-Toyota, BMW Brilliance, Beijing Benz? Are they half-Chinese players who can borrow from the bloc, or miniature Europes inheriting every parental defect?
The answer is neither. They are borrowers with borders and a deadline — and the borrowing is no longer a strategic option; it is completed procurement.
Lay out the facts. Momenta’s public customer list contains SAIC-VW, GAC-Toyota, and Dongfeng Nissan outright. The end-to-end stack BMW co-developed with Momenta enters production with the China-built next-generation iX3 in 2026 and extends to Neue Klasse China models. The urban-navigation function of Mercedes’ China-market electric CLA is Momenta’s; the two upgraded their MOU in February 2026; and by April’s Auto China, even the new S-Class — sixty years of the brand’s technical flagship — carried Momenta’s stack. Hyundai signed on in April 2026. By end-2025 Momenta counted over one million vehicles on the road, 68 production models, and a 64.5% global share of urban L2 navigation assistance (Frost & Sullivan), listing in Hong Kong on July 8, 2026. One observer’s summary of this year’s Beijing show was accurate: every foreign OEM in the hall is now a customer of CATL, Momenta, or Huawei. And VW went furthest — not borrowing an ADAS stack but co-developing a China-exclusive E/E architecture (CEA) with XPeng and standing up CARIZON with Horizon Robotics. It didn’t borrow the table; it rebuilt one in China.
But the borrowing has three borders, each drawn hard.
The first is a national border. The U.S. Commerce Department’s January 2025 final rule bars connected vehicles containing Chinese-linked software from the U.S. market from model year 2027 (hardware from MY2030). The borrowed table cannot enter the United States; European regulators sit in suspended review; inside China the road is clear — borrowed intelligence runs on Chapter 1’s three clocks too. Say the strategic meaning plainly: borrowing saves the China campaign; it cannot repay the parent’s global architecture debt. The same company’s China cars run on Momenta’s stack while its global cars run on the parent’s old table — two intelligence stacks, two proof obligations, double cost. That is not a transformation. That is a split brain.
The second is a governance border. Whose cars carry the borrowed stack, who owns the data, who holds OTA sovereignty, who signs the next procurement — inside a 50:50 structure, every one of those is a negotiation (BMW Brilliance, at 75% BMW-held, is the exception). A bloc-side Chinese OEM borrows as one decision-maker; a JV borrows as two — and Chapter 2 noted this game’s clock ticks in weeks.
The third is a profit border. Borrowed stacks are paid for, and the paying capacity is decaying: mainstream JV brands’ retail share in China has fallen from a ~60% peak in 2020 to roughly one quarter (CPCA basis: 27.5% in 2024, ~24.9% in Q1 2026). The borrowing begins exactly when the ICE cash cow that would fund it is leaving the field — a race against time, not a steady state.
The JV endgame therefore collapses to one criterion: whether the parent grants the China entity genuine architectural sovereignty. Where granted (VW’s VCTC/CEA path; Audi’s new brand with SAIC), the JV can evolve into a quasi-Chinese OEM inside a bloc — even a reverse-transfusion interface back to the parent; on Figure 3.1 that adds a displacement correction to the parent’s coordinates, valid only inside China. Where withheld — where the JV remains a local sales channel for global platforms — three exposures stack: the fiercest market, the oldest table, the fastest-vanishing profit. Possibly the single most exposed cohort in the entire industry (inference-grade).
One reading rule for Figure 3.1 follows: joint ventures do not appear as independent points (they hold no independent five-dimension scores); their position = the parent’s coordinates + a borrowability correction — its size set by the degree of architectural sovereignty granted, its validity ending at the border.
4.5 One sentence, then hand over
Compress the chapter to a sentence: driverless technology will not kill car manufacturing — it will kill the business model that only manufactures and sells cars. Manufacturing demotes from profit source to cost item; profit migrates to Driver, operations, and gateway — none of which grow on a legacy OEM’s balance sheet.
The formula has changed; next to be rewritten is the machine configured for the old formula: the R&D system. When the buyer changes from a consumer paying for steering feel to a fleet paying for cost-per-kilometer and uptime, R&D’s value function — which disciplines appreciate, which depreciate, which engineers get repriced — goes through the article’s most personal chapter. Next: the people.
5. Rewriting the Value Function: the people chapter
The first four chapters were about companies, tables, and money. This one is about people — if you are sitting in an OEM’s R&D building right now, this chapter is written to you. It is also the least seriously discussed layer of the upheaval, and the one that touches every individual in the organization most directly.
5.1 R&D loses its finish line
Traditional automotive R&D has an origin point everyone accepted for a century: SOP. Product definition, concept, system design, component development, prototypes, testing and certification, start of production — every process aims at that point, every KPI counts down to it; cross it, hand the product to manufacturing and aftersales, and turn to the next vehicle program. SOP is R&D’s finish line.
Driverless operation erases the line. Chapter 2 said it: in the fail-operational world, “release” is not a date but a lifelong pipeline — continuous collection, training, simulation, release, monitoring, argumentation. The day the vehicle ships is the day the pipeline starts turning — it used to be that R&D ended and handed to operations; now the product ships and R&D truly begins its long operational life. R&D and operations fuse from two departments into one loop.
Move the origin and the units change with it. The old KPIs ask: were milestones met, what’s requirements coverage, what’s the defect count, did SOP hold. The new ones ask: interventions per thousand kilometers, success rates in critical scenarios, driverless availability, minutes to a rollback, days in the data-loop cycle, operating cost per kilometer. The difference between those two sets is not difficulty. It is tense: the old KPIs are all perfect tense; the new ones are all progressive. An R&D organization that thinks in the perfect tense and one that thinks in the progressive tense are two different species.
5.2 Disciplines up, disciplines down
Rewrite the value function and every discipline’s reading changes. The risers first.
Fail-operational vehicle and E/E architecture ranks first — every clause of Chapter 2’s contract needs someone to draft it into drawings: full-path redundancy, ASIL-D decomposition, fail-degraded paths, fault isolation. It is one of the few legacy-OEM capabilities no internet company can substitute, and the human form of Chapter 3’s card. Validation and safety-case engineering follows — once validation takes half or more of L4’s workload (Chapter 2’s inference-grade call), “the people who prove the system safe” turn from support role to core discipline, and the more regulation matures, the more they cost. Fleet-grade OTA and DevOps is the third peak: with vehicles running 100,000 km a year, software iterating weekly, every push wired to safety liability — staged rollout strategy, rollback mechanics, release trains fused with functional-safety and security audit chains — OTA graduates from feature to lifeline; the teams that have truly hardened this, industry-wide, fit on one hand. The last peak carries irony: cabin and experience. With driving withdrawn, the cabin becomes the third space; HMI, interiors, cleanability, in-cabin services all gain weight — Interieur may be the only mechanical discipline in legacy R&D whose weight rises.
Now the fallers, said straight. After ICE powertrain, the next cohort of structural depreciation shares one trait — its object of service is the human driver: drivability calibration, shift quality, co-driving HMI, driver-centric legacy active safety (AEB, LKA and their kin, absorbed wholesale into the L4 stack). The driver exits; the engineering that served the driver exits behind him — the logic is that simple, and that cold. Depreciating alongside is something intangible: the vehicle-program development process itself. The five-year SOP cycle, the Lastenheft waterfall decomposed level by level to Tier-1s — structurally incompatible with weekly software cadence. Not a new observation; but driverlessness turns SDV transformation from “should do” into “do or die,” and compresses the timeline from ten years to five.
One qualifier: the above applies to fleet and volume markets. In sports cars, luxury, and driving-as-joy niches, driver-pleasing disciplines keep territory — shrinking territory, no longer the R&D main front.
5.3 The middle is the most fragile
The organization’s shape must also be said through: it becomes smaller, more software-defined, and polarized. One pole: a small corps of deep systems engineers — architecture, redundancy, safety argumentation, vehicle integration — of extreme individual value. The other pole: an execution layer massively leveraged by AI tooling, headcount steadily shrinking — a shrinkage R&D managers are driving themselves, with agentic AI landing in documentation, test generation, and compliance tracing among the fastest-growing budget lines.
The dangerous ground is between the poles. Requirements engineers who relay but don’t understand the system; module owners who manage suppliers but not technology; project managers who maintain meetings and milestones; process roles fluent only in one company’s internal tools — the layer whose value derives from organizational interfaces and process knowledge, which is exactly what generative AI and engineering automation eat first. An engineer’s value test converges to five questions: can you make system decisions; can you read data; can you judge risk; can you cross software, hardware, safety, and operations; can you answer for real operating outcomes. “Knowing how the process runs” appears in none of the five.
Compress 5.2 and 5.3 into one chart.
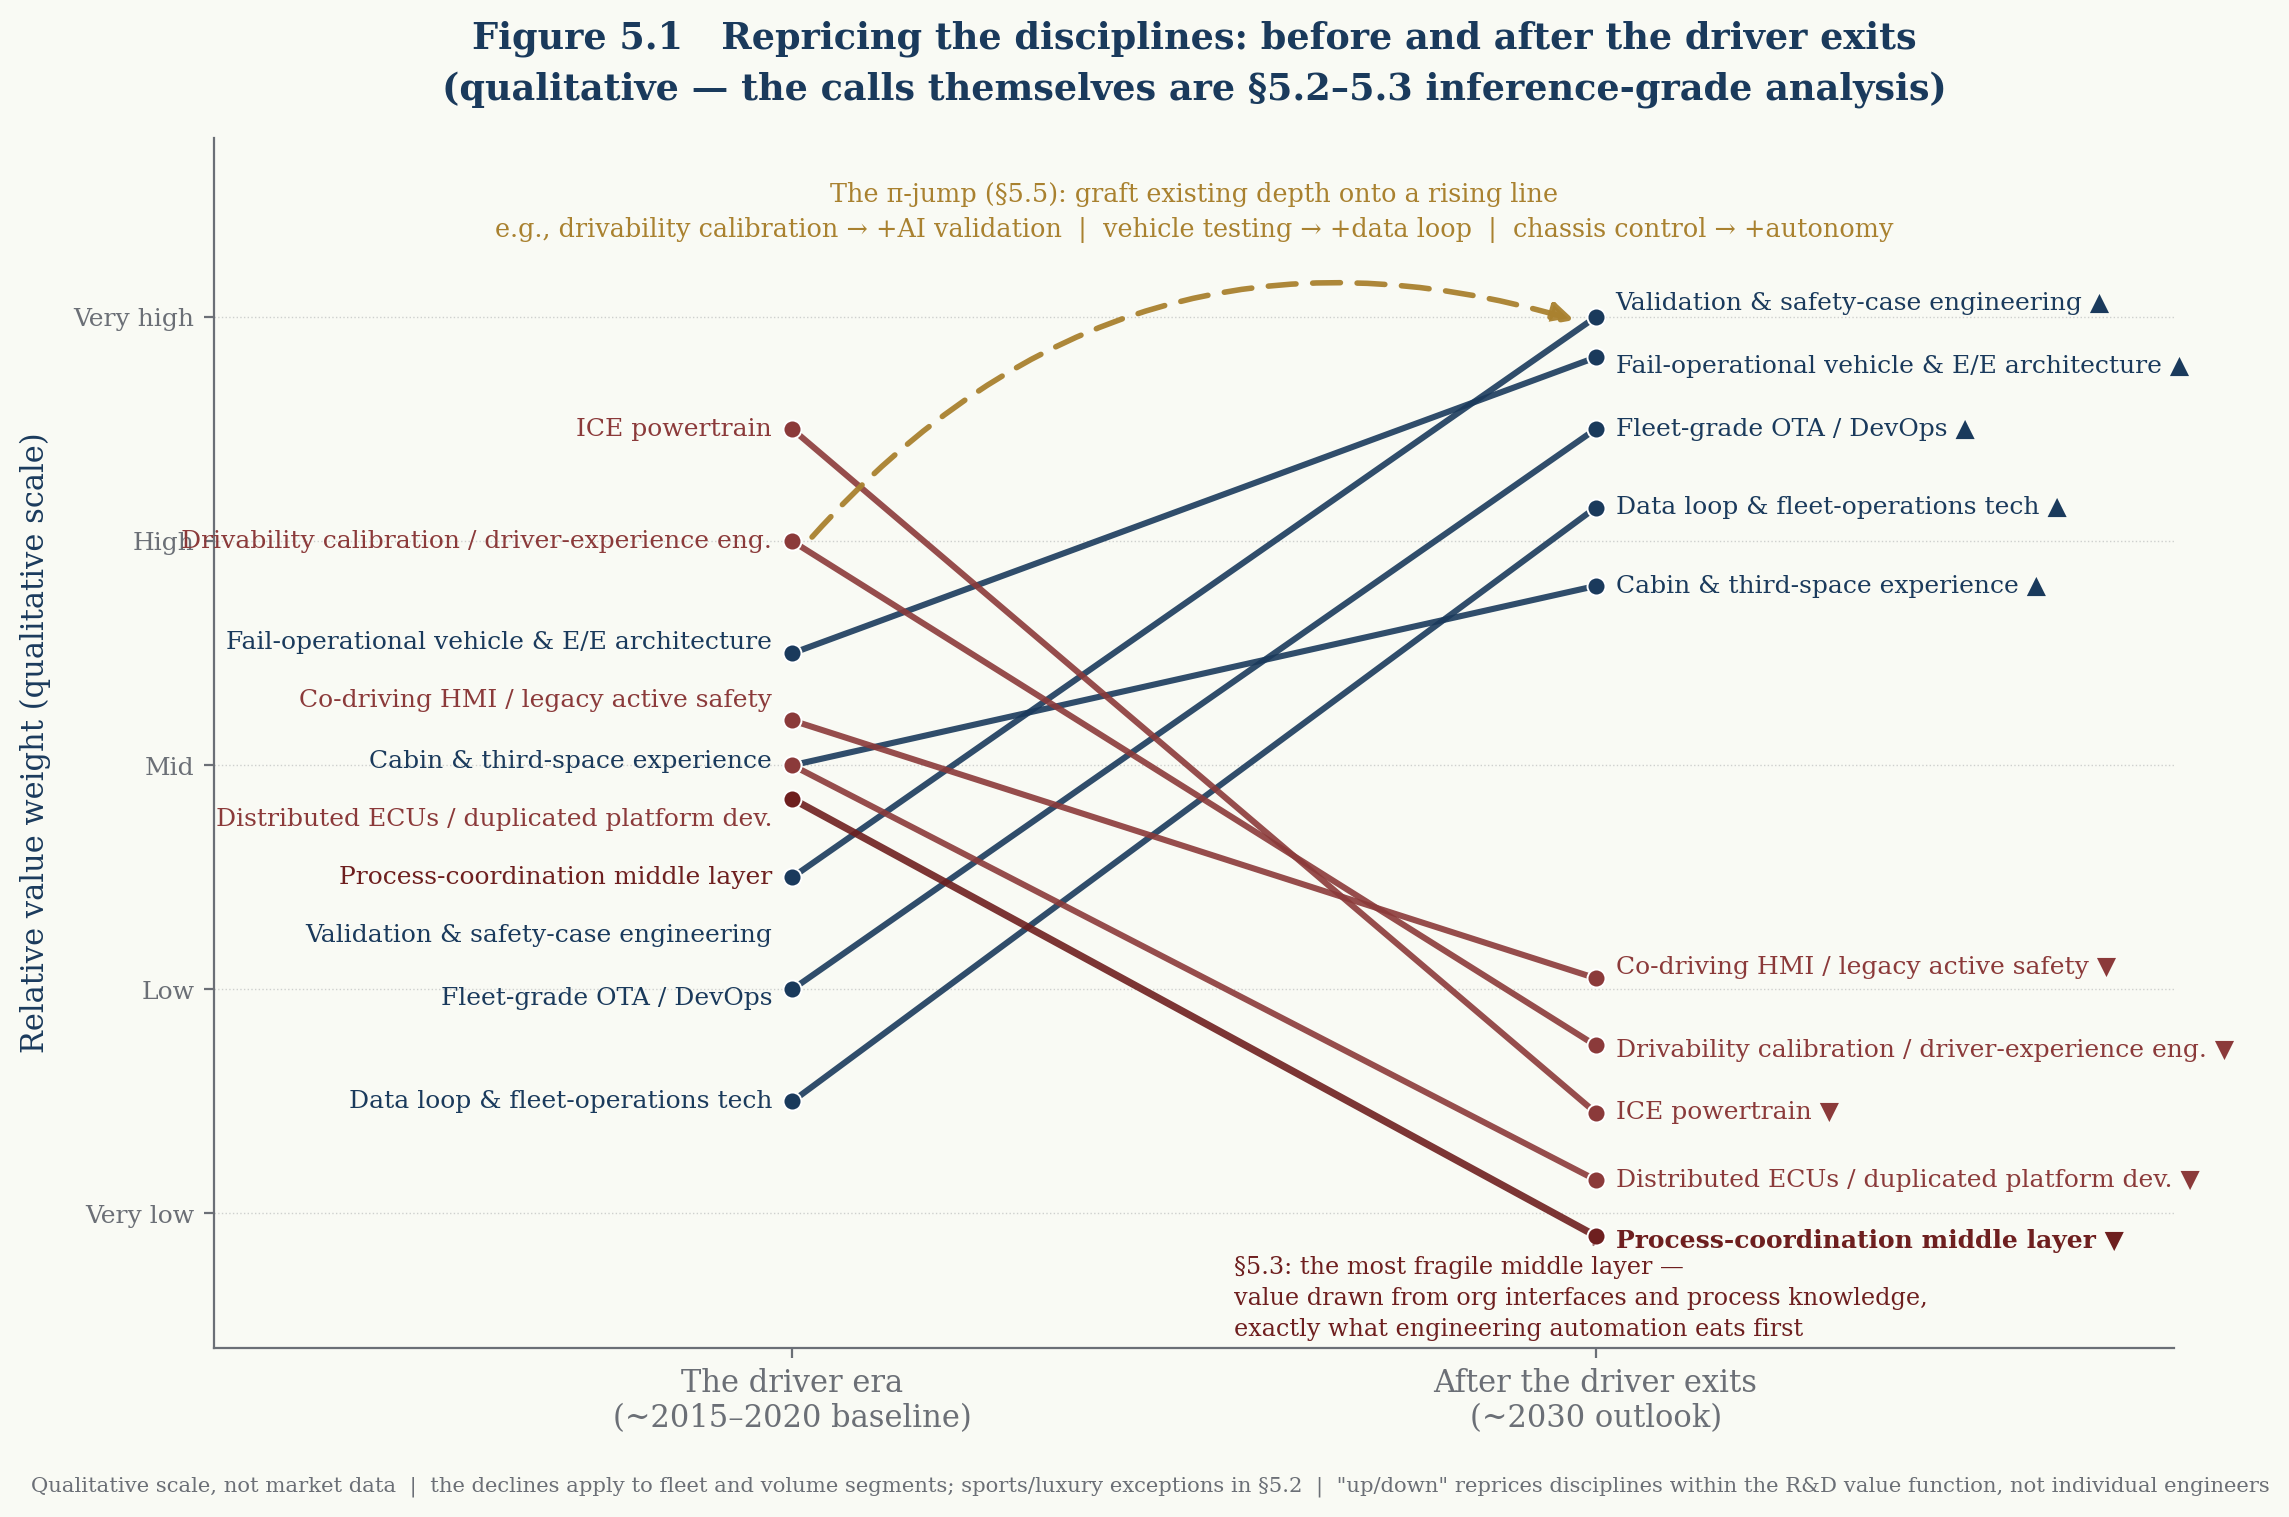
Figure 5.1 — Repricing the disciplines. Left axis, the driver era (~2015–2020 baseline); right axis, after the driver exits (~2030 outlook); navy lines rise, dark-red lines fall; the vertical scale is a qualitative value weight — unlike Figure 3.1 this is not a data projection: the calls are themselves §5.2–5.3’s inference-grade analysis, stated openly. Three readings: first, the fallers’ common trait is visible at a glance — they all serve the human driver; second, the steepest fall is no mechanical discipline but the process-coordination middle layer (bold line) — §5.3 drawn as the sharpest slope; third, the gold dashed arc is all of §5.5 — the π-jump: the individual hedge is neither holding a falling line nor parachuting to the base of a rising one, but grafting existing depth onto a rising line, mid-slope to mid-slope. The declines apply to fleet and volume segments (sports/luxury exceptions in the text); “up/down” reprices disciplines within the R&D value function, not individual engineers.
One organizational undercurrent, as damaging to senior managers as to line engineers: once the Driver stack is procured externally, R&D’s political position inside the company falls — budget share, board voice, the balance of power against purchasing and sales all reshuffle. The department that integrates someone else’s software and the department that defines the product’s soul do not sit the same way in a budget meeting. Companies choosing Exit A need to think this layer through in advance.
5.4 A note on E/E architects
This position deserves its own section — not only because it is this research series’ core readership, but because it stands at the geometric center of the whole rewrite.
If the employer takes the licensing route, the architect’s job changes in nature, not existence: from designing the autonomy domain to designing the vehicle platform that hosts an external Driver. The work doesn’t disappear; it shifts from leading to interface definition and integration — and the position’s leverage hangs on one brutal variable: is your platform good enough that the Waymos accommodate your interfaces, or do you accommodate theirs. Translated onto Figure 3.1: an architect’s personal leverage is moving the employer’s dot to the right. Your organization’s x-coordinate sets the nature of your daily work — an architect in an AR1.5 organization is paying down architecture debt; an architect in an AR3+ organization is building the table. The former’s day is decoupling history; the latter’s is defining the future. Same job title, two entirely different careers.
One more requirement arrives from Chapter 2’s chip spec: when the proof obligation penetrates to the reasoning layer — when even the chip running the large models must be SIL3-lockstep — the architect must become bilingual: AI stack in the left hand, safety argumentation in the right. An architect fluent in only one holds half a seat at the next platform’s definition table.
5.5 The individual hedge
Finally, an action frame for individuals, as honest as we can make it. (This section is inference-grade career judgment, not universal advice.)
The transferability ranking runs roughly: the compound of systems engineering + functional safety + software delivery process > any single software skill > any single mechanical discipline. Note that first place is no single item but a compound — after the rewrite, what is scarce is not a skill but the axle connecting the vehicle’s physical world to the software, data, safety, and operations loop.
For people with automotive depth, the highest-value path is not discarding the accumulation to become an AI researcher from zero, but picking an intersection and grafting old depth onto a new dimension. Higher-priority combinations include: E/E architecture + software-defined vehicles; functional safety + AI validation; vehicle testing + data loops; chassis control + autonomy; vehicle networking + cybersecurity; quality management + continuous software release; product definition + fleet-operations economics. In each pair, the left side is what you already have; the right side is the value function’s new weight.
The direction compresses to a maxim: move toward the system layer and the safety layer; move toward “proof” and “integration” — do not compete head-on with AI companies on perception and planning algorithms. That is their home field, their data, their pay curve; your home field is Chapter 2’s contract.
Two states to close. The lowest-value future state: fluent only in one OEM’s internal processes, unable to independently explain the system, the data, or the business outcome. The highest-value future state: understanding the vehicle’s physical world and participating in the software, data, safety, and operations loop. The distance between those two states is each practitioner’s own transformation window — like the companies’, narrower than imagined, and still open today.
The repricing of people, told. And the repricing of people and the repricing of capital were always two faces of one rewrite — next chapter, follow the money.
6. Where the Money Goes: the value-chain reshuffle
6.1 Rules first
This chapter sets three rules before it is written — stricter than any other chapter’s.
First, this is industrial-structure analysis, not investment advice. No tickers, no timing, no position sizes; what is offered is structural judgment — toward which links value is migrating, what traits each link’s winners will need, and each link’s principal risks. What readers do with that is their own affair. Second, the entire chapter is inference-grade, held strictly to Chapter 1’s three ARK-audit rules: call directions; ranges for time; uncertainty flagged on magnitudes. Third, restate ARK’s lesson, harder: direction is easy to hit; time is brutal. Someone who saw every direction correctly in 2017 and sized up on ARK’s timeline in 2019 then had to survive seven years — in capital markets, “too early” and “wrong” have identical cash-flow curves.
Rules set. Walk the chain.
6.2 Seven links, one by one
Link 1: Driver ecosystems. The trinity of algorithms, data, and operating permits. Chapter 4’s flywheel logic dictates a highly concentrated endgame — two to three global ecosystems plus regional players — and it is the chain’s most narrative-saturated, most expensively priced link: Waymo’s $126 billion pre-pays a large share of endgame assumptions (FutureSearch’s read: “modestly overvalued”). Its idiosyncratic risk is also the sharpest: the narrative kill-power of a single severe incident (Cruise is the precedent — one mishandled accident ended a ten-billion-dollar program), plus regulatory discontinuity. Structural call: winner-take-most, but the ticket is already expensive.
Link 2: the redundant by-wire chassis and Tier 0.5 — the underrated physical layer. The link this chapter most wants to light. Chapter 2’s hardware clauses — fail-operational braking, steering, power — are a mandatory purchase for every driverless vehicle, whoever’s Driver wins. The classic picks-and-shovels position: don’t bet the prospectors, sell what every prospector must buy. Winner traits are clear: by-wire actuator production discipline, ASIL-D-grade redundancy engineering, manufacturing consistency at hundred-thousand scale — assets sitting today with top Tier-1s and Exit-B OEMs. The risks, equally clear: manufacturing’s margin ceiling, and Chapter 3’s reverse-definition countdown (Ojai has shown AV firms can write the spec) steadily compressing the link’s leverage. Structural call: highest certainty, lowest ceiling; realization window about five years (per Chapters 2–3’s inference-grade shelf life).
Link 3: fleet operations and depot networks. Chapter 4 called this layer nearly unclaimed; complete its portrait here: regional, asset-heavy, cash-flow-natured — closer to a hybrid of infrastructure and commercial real estate than to a tech stock. Siting, charging load, cleaning and staging, remote-assistance centers: local businesses all; and Waymo’s city-by-city bottleneck sits exactly here. Likely entrants: mobility platforms, energy companies, property operators, and OEM captives pivoting from consumer auto loans to fleet asset finance. Structural call: the least crowded link on the chain, with the highest reuse of legacy assets — and the only one legacy players can enter without first repaying architecture debt.
Link 4: validation, simulation, and the safety-case toolchain — armorers of the proof obligation. If Chapter 2’s call holds directionally (validation and argumentation above half of L4 workload), the market supplying tools and methods for that workload expands rigidly as regulation matures — every inch SOTIF- and UL 4600-class frameworks land, demand hardens an inch. And supply is far from saturated: our D4 benchmark of twelve architecture-toolchain subjects found AI generation capability (dimension D3) decoupled from reasoning autonomy (dimension D4), with SCADE the only subject touching L3 in the entire set. Structural call: demand underwritten by regulators, supply visibly gapped; principal risks are unsettled standards and customer concentration. (Per series practice: this link adjoins our team’s commercial neighborhood; this article cites only D4’s published findings on it and makes no supply-side judgment beyond published content.)
Link 5: insurance and reinsurance. Chapter 4 described the species change — driver actuarials to system-liability pricing. Swiss Re’s positioning demonstrates the winner trait: not capital scale, but a data methodology capable of issuing a risk profile for a software system. In the long tail, two embryonic lines: software liability and fleet cyber. Structural call: the pool may shrink (fewer accidents), but pricing power redistributes through the species change — even a shrinking pool crowns new kings.
Link 6: cabin and third space. With driving withdrawn, the cabin is the remaining differentiation battlefield and the physical carrier of content, services, and commerce — ARK priced in-vehicle entertainment and advertising in the hundreds of billions back in 2017, and the direction still stands. The risk is gateway power: if booking, payment, and the user relationship sit with the mobility platform, cabin suppliers run a contract business and the gateway premium is skimmed upstream. Structural call: a real market whose split depends heavily on Link 1’s outcome — downstream, not an independent lane.
Link 7: energy and charging. Fleet charging is a grid operator’s favorite load — concentrated, predictable, dispatchable — naturally coupled to depot networks. Structural call: not a protagonist, but possibly the lowest-friction beneficiary of the reshuffle.
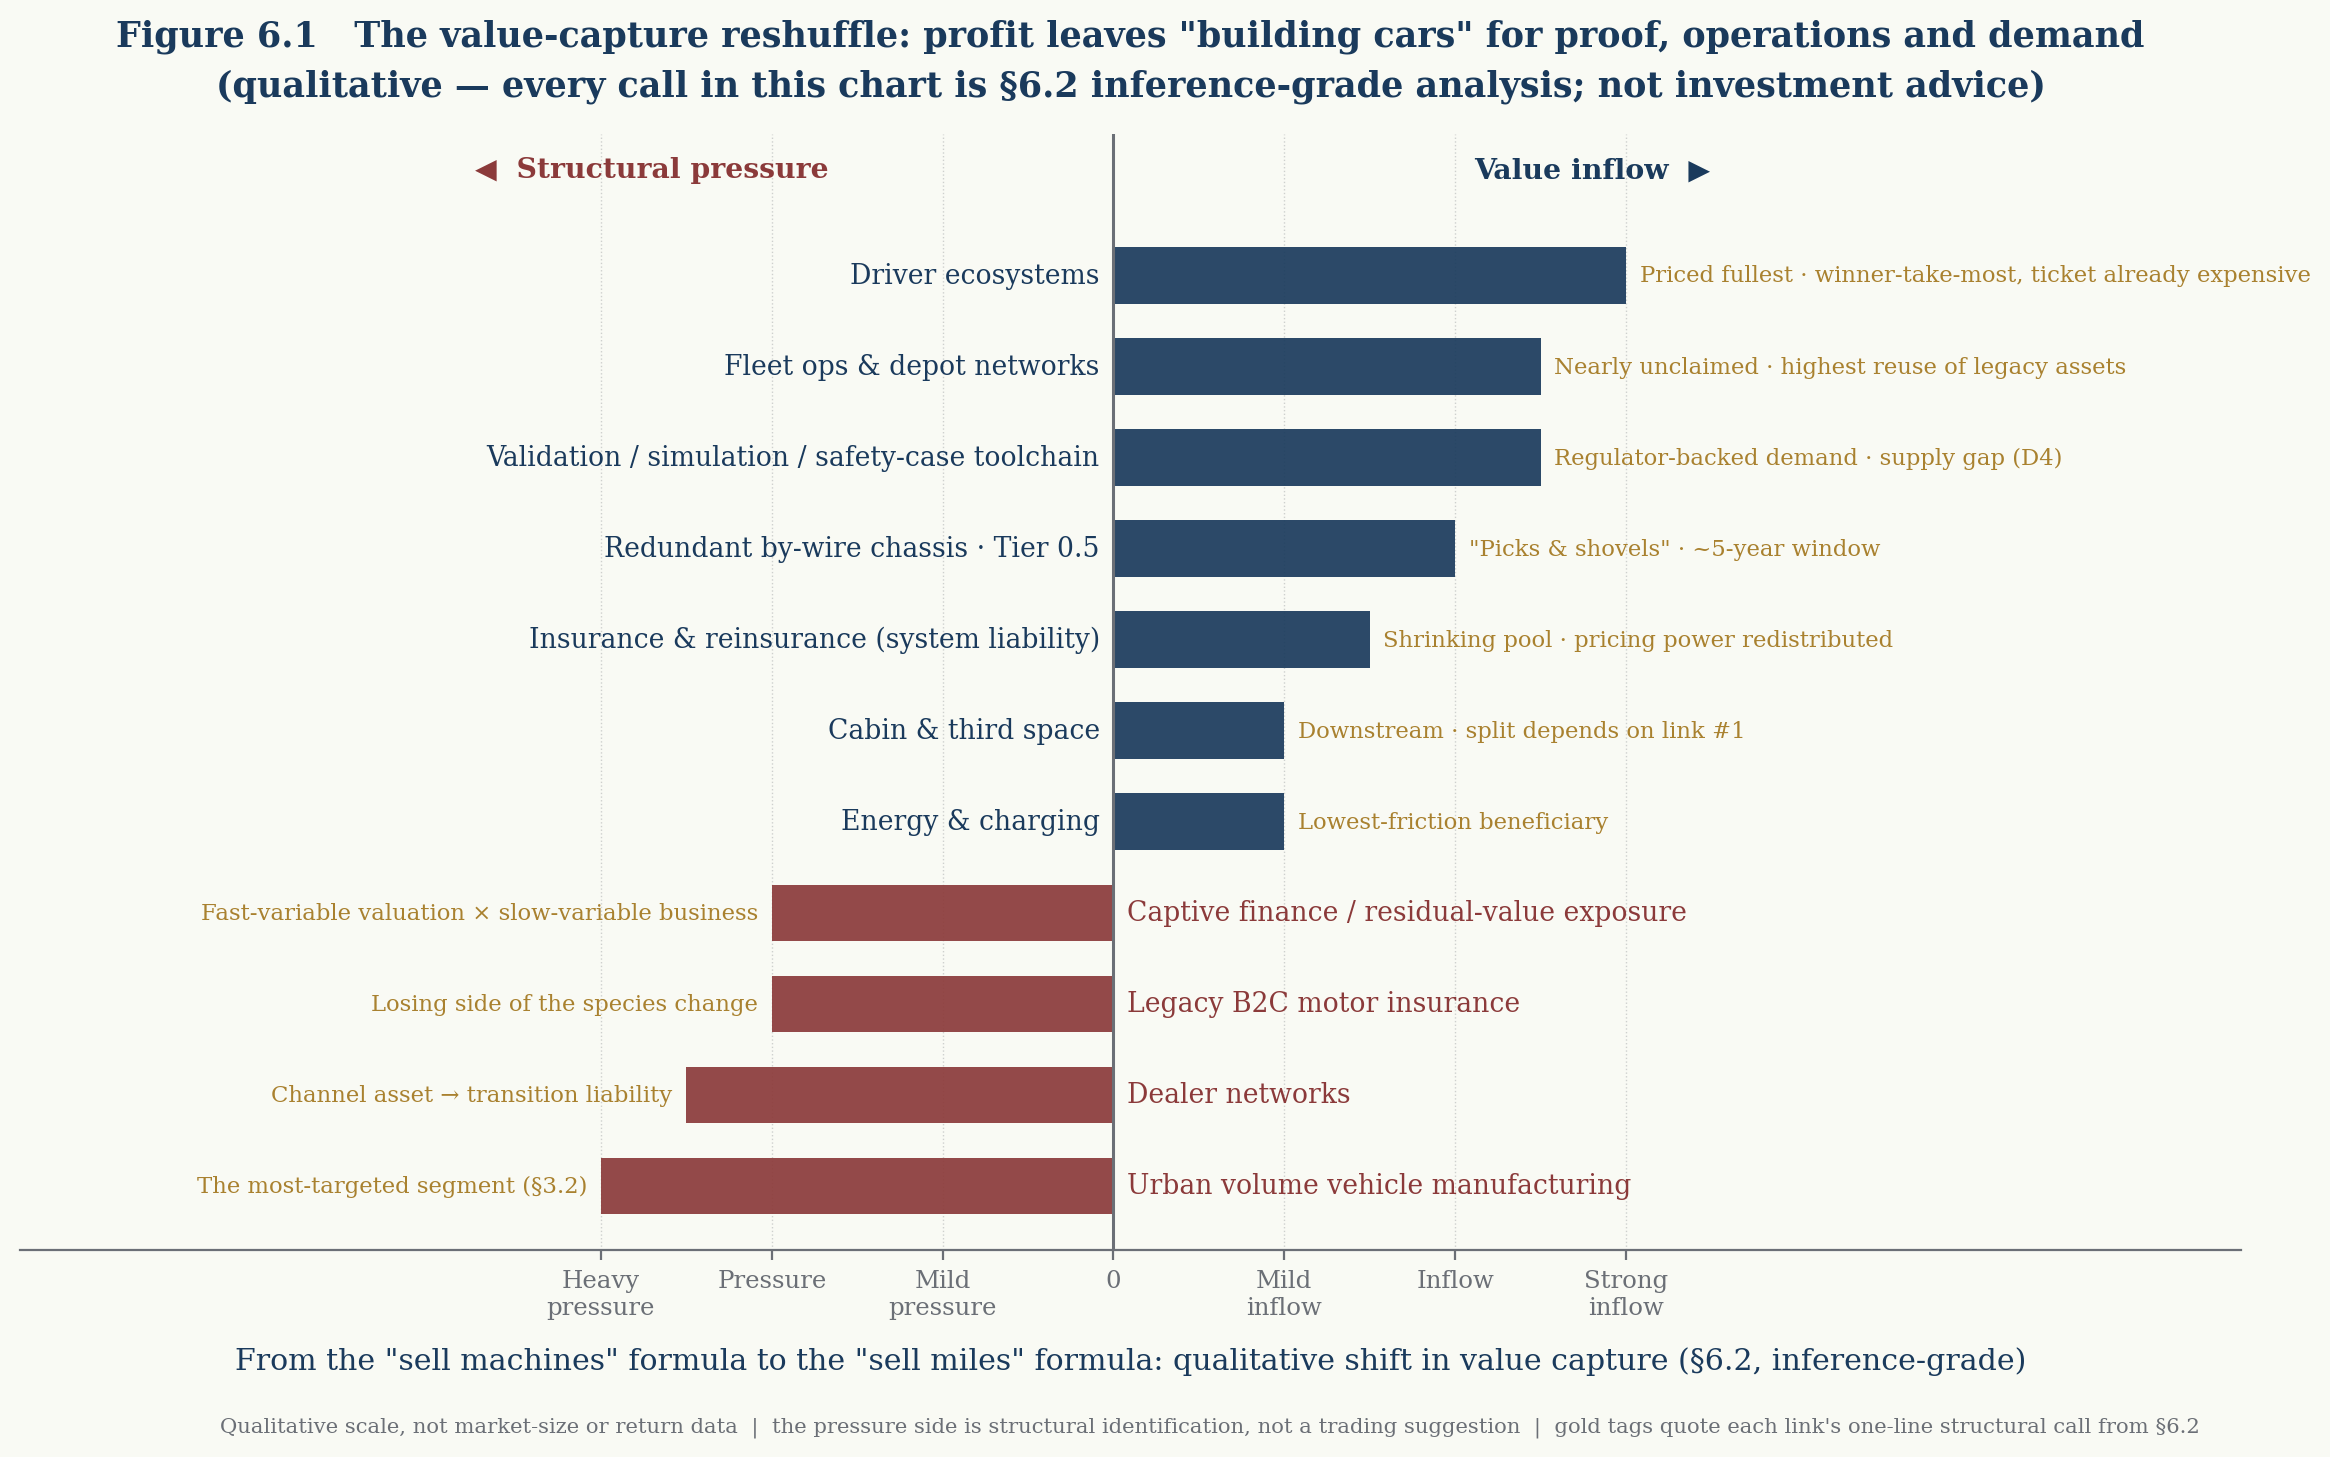
Figure 6.1 — The value-capture reshuffle. Left of the zero axis, four dark-red bars of structural pressure; right, seven navy bars of value inflow; bar length is the qualitative shift in value-capture weight; gold text quotes each link’s one-line call from §6.2. As with Figure 5.1, this is a qualitative exhibit, not market-size data — the bar lengths are themselves §6.2’s inference-grade judgments, stated openly. Two readings: first, the seven right-hand bars are not seven equivalent opportunities — the longest (Driver ecosystems) carries the tag “ticket already expensive,” while the middle three (depots, the validation toolchain, Tier 0.5) are the least-narrated, structurally hardest part; second, the two sides are not symmetric — the right side’s inflows realize over years, while the left side’s pressure arrives via valuation repricing, in weeks: the precise place where “slow-variable business meets fast-variable valuation” hurts most. The pressure side is structural identification, not any operating suggestion.
Finally the pressure side, in equally restrained language — the following is structural identification of stressed links, not any operating suggestion: urban volume-segment vehicle manufacturing (Chapter 3: the most-targeted band); dealer networks (channel asset turned transition liability); legacy B2C motor insurance; and captive finance’s residual-value exposure — with Chapter 3’s reminder that capital-market repricing of these links will precede the actual change in consumer behavior. Slow-variable businesses wearing fast-variable valuations: the most underestimated pain of the reshuffle.
6.3 The three clocks, third appearance: this article as a due-diligence checklist
Chapter 1’s clocks governed the tipping point; Chapter 4’s, the borrowed intelligence; here they govern pricing.
The three markets’ assets sit in three pricing states. America is priced fullest — Link 1’s endgame assumptions are heavily embedded. China is the most complex — bloc structure means “buying the flywheel” requires decomposing alliances; Momenta’s early-July listing is this market’s first pure-play signal. Europe is priced most pessimistically — the German big three together worth roughly one Waymo (Chapter 4’s reconciliation) means the market has already written most of “the turn fails” into the price.
This article does not judge which of the three pricings is right. What it can offer is different: use the preceding five chapters as a due-diligence checklist. When you need to judge whether any OEM’s turn is credible, the checkable evidence items are: its AR-ladder position and climb slope (D2’s dual time dimensions); its card-to-table ratio (Figure 3.1); whether its JV entities hold architectural sovereignty (§4.4’s single criterion); whether its board has left verifiable actions on the switch date (Chapter 3’s only open variable); and whether its R&D organization thinks in the perfect or the progressive tense (§5.1). Frameworks don’t predict prices; frameworks audit narratives — and the most expensive thing in this market is precisely a narrative that has been audited.
6.4 Closing
The reshuffle in one sentence: profit is leaving the “build the car” link for the three links of proof, operations, and gateway — with Links 2 through 4 the mid-section that narrative underrates and structure favors.
The industry’s ledger is closed. Last chapter: gather the article’s judgments and honor Chapter 1’s promise — directions called, ranges for time, uncertainty flagged. Three judgments, one warning.
7. Conclusion: three judgments and one warning
Chapter 1 extracted three rules from the nine-year ARK audit: call directions, give ranges for time, flag uncertainty on magnitudes. Time to pay. Each judgment below is delivered in that format — stating what it bets on direction, what range it gives on time, and what it suspends on magnitude.
Judgment I: the tipping point has passed — but not the way most imagined
Direction: robotaxi commercialization in top U.S. cities has crossed its critical point — safety has entered the reinsurance-actuarial pricing stage, and the capacity curve compounds at “double per year”; both are irreversible. Range: 2026–2028 is the window in which top cities turn from novelty into infrastructure; global substitution of private ownership is a fifteen-year gradient, wildly uneven across the three clocks. Suspended magnitudes: when cost per mile approaches the private car, and how much of the parc substitution finally eats — this article gives no numbers, only the direction’s inevitability and the ARK-style timeline’s danger.
From which follows the judgment’s most important half-sentence: legacy OEMs will not die by cliff, but by the layer-by-layer stripping of urban volume-segment profit — and capital markets will move first. Slow-variable businesses wearing fast-variable valuations: repricing runs years ahead of the sales decline. On the day the delivery report confirms the crisis, the market’s verdict will have long been executed.
Judgment II: there is a place for OEMs in the endgame — but the good seats have one lever and five years
Direction: legacy OEMs survive in the endgame, but the default seat is mid-to-downstream — hardware platforms, manufacturing, depot aftersales. To hold anything higher, one lever exists: make the fail-operational vehicle platform plus fleet-grade SDV delivery something Driver ecosystems cannot do without — climbing from Tier 0.5 toward platform partner. Range: the lever’s shelf life is roughly five years — Ojai has demonstrated reverse vehicle definition; once “who defines” and “who builds” separate, manufacturing leverage counts down. Suspended: each OEM’s specific fate. This article delivers the verdict variables, not verdicts: card (D4 functional-safety assets), table (architecture-platform maturity), sovereignty (whether JV entities hold architectural authority), date (the year of the D-to-A/B/C switch). Figure 3.1 supplies readings for the first two; the last two live in each company’s own board minutes.
Judgment III: R&D’s value function is rewritten — the individual’s exit is the jump-line, not the holdout
Direction: to R&D, driverlessness is not another technology domain but a wholesale rewrite of the value function. Winning disciplines — redundant architecture, safety argumentation, validation engineering, fleet OTA/DevOps, cabin experience. Losing disciplines — everything whose object of service is pleasing the driver, plus the SOP-terminated process itself. The organization evolves from a perfect-tense species to a progressive-tense one; the most fragile layer is not the poles but the middle. Range: the rewrite runs at SDV-transformation frequency, its timeline compressed from ten years to five. The individual maxim (inference-grade; Figure 5.1’s gold arc): toward the system layer and the safety layer; toward proof and integration; graft existing depth onto a rising line — mid-slope to mid-slope — and do not fight AI companies head-on over perception and planning. The E/E architect’s lever is the most concrete: move the employer’s dot rightward, and become the bilingual — AI stack in one hand, safety argumentation in the other.
One warning: to Europe, and to everyone who mistakes lag for safety
Europe’s regulatory lag is a buffer, not a moat — this article has said it three times; the last time must be complete. Whoever enters when the EU’s L4 framework matures will be an ecosystem that finished its data flywheel and cost decline in America and China; and borrowed intelligence has borders — Europe doesn’t even hold China’s “borrow from the bloc” option. What stings more is Figure 3.1’s reading: Europe’s D4 lead is a genuine card, but a card does not convert itself into a seat — without the table (architecture platform), without a sovereignty decision (architectural ownership across JVs and alliances), without a dated action (a verifiable board resolution), the card’s redemption window closes in five years, and European OEMs will carry the industry’s best functional-safety assets into the value chain’s contract-manufacturing seats. The window for the turn is narrower than most boardroom slides draw it — this article’s estimate: narrower by half.
Revision triggers
This article belongs to the Writing series — revisable observation, not locked claim. Its conclusions therefore carry their own falsifiers. If any of the following occurs, a revised edition will be published with changes marked:
- Tipping-point trigger: if by end-2028 driverless operating trips per week have not at least doubled from mid-2026, or unit economics show no improving trend (fare/cost basis), Judgment I’s “critical point passed” is downgraded to “critical point in doubt.”
- Option trigger: if Tesla successfully pushes unsupervised capability to consumer-owned vehicles and clears both regulatory and insurance validation, Chapter 1’s “option on display, not a capacity” characterization is void, and Chapter 2’s estimate of the proof obligation’s weight is revised down.
- Window trigger: if before 2028 an AV company takes substantive steps to build or majority-own vehicle manufacturing capacity, the “five-year shelf life” shortens; conversely, if contract-manufacturing margins run significantly above manufacturing norms, Class 3’s “thin margin” call is revised up.
- Clock trigger: if the EU’s L4 type-approval framework lands before 2027 with a first scaled operating permit, the “three-to-five-year lag” range is revised down and the warning’s tone softened.
- Bloc trigger: if a single operator in China achieves cross-bloc data exclusivity, the “alliance blocs” judgment is void and the China-exception clause rewritten.
We do not intend to be audited in 2035 the way Chapter 1 audited ARK — so the ledger is laid open here.
Coda
Back to the title. The driver has exited, but the fallback has not vanished — it has become a contract that must be co-signed by redundant hardware, verification evidence, and actuarial data. That contract has repriced every company, every discipline, every engineer — and repriced the words “auto industry” themselves.
The auto industry has not lost its future. It has lost a default — the default that the future would automatically resemble the past. And where defaults fail, what remains are decisions: whether to switch, when to switch, with what. What this article can do is lay the coordinate system on the table; the hand that presses the button was always the reader’s own.
Appendix: source-tier notes by chapter
Chapter 1
- Tier 1 (official/primary): Alphabet/Waymo earnings and official blog (weekly trips, financing, expansion announcements); Waymo’s Dec 2025 NHTSA filing (3,067 vehicles); Toyota–Waymo joint statement, Apr 29, 2025; Tesla Q1 2026 earnings call (Musk on revenue and validation constraints); Waymo–Swiss Re joint study (25.3M-mile claims data).
- Tier 1 (supplementary, Jul 22, 2026): Tesla Q2 2026 Update — seven metros and three Florida launches in July; cumulative paid Robotaxi miles (~2.4M, chart reading); 1.48M FSD subscriptions and 11B+ cumulative miles (chart readings); >55% North-American attach rate; Cybercab production start and >125k/yr installed capacity; Phoenix/Las Vegas preparations; FSD approvals in five European countries and 50M km.
- Tier 2 (reliable secondary/independent tracking): FutureSearch forecasts (weekly trips, Ojai timing); Robotaxi Tracker fleet counts (Tesla unsupervised vehicles); Obi fare study; Electrek/CNBC/TechCrunch/Road to Autonomy reporting.
- Tier 3 (report-grade, unconfirmed): the Hyundai–Waymo 50,000-vehicle order talks (Gasgoo first report; no signing confirmed as of July 2026).
- Inference-grade (this article’s judgments, flagged in text): the “option on display” characterization of Tesla Robotaxi; the “one Tesla year ≈ one Waymo week” order-of-magnitude comparison (rests on per-trip-mileage assumptions); China’s “alliance blocs” pattern (operators named qualitatively; no quantitative claims); Europe’s 3–5-year lag range; §1.5 as a whole.
- ARK Invest, Mobility-As-A-Service (Oct 2017), cited as a historical forecast document; its predictions are not used as sources of present fact.
Chapter 2
- Tier 1 (official/published research): D1 §3.3 (the failure-philosophy watershed) and §3.7 (the two-layer verdict), as published; the Qualcomm Dragonwing IQ10 System-2 specifications verified in Deep Dive 2026-07 (SIL3 lockstep, safety island, ECC, Safe RTOS; investor-day materials, Tier 1); ISO 21448 / UL 4600 / ISO 26262 as public standards.
- Tier 2: the mid-2026 Waymo freeway pause (multi-source); Tesla’s Austin unsupervised fleet count (Robotaxi Tracker; see Chapter 1).
- Inference-grade (flagged in text): validation and safety argumentation “likely above half” of L4 workload; the OEM chip’s ”≈ five-year shelf life”; “strike price = contract signing cost” as rhetorical equivalence.
- The chapter’s extension of D1 §3.3 — “the driver-equipped automobile long stood on the gentler side (fail-safe); driverlessness forces the crossing to fail-operational” — is a new claim of this article and does not revise any published D1 conclusion.
Chapter 3
- Tier 1 (official/published research): D2’s 22-OEM scoresheet (Appendix A.2; Snapshot Jan 31, 2026 / Roadmap Jul 2027) and its “functional-safety certification ≠ architecture maturity” finding; Toyota–Waymo agreement (Apr 29, 2025); GM’s Cruise shutdown (announced Dec 2024) and Argo AI’s dissolution (2022) as public facts.
- Tier 2: Cruise cumulative spending above $10B (multi-source financial-report tallies); Ojai contract-built by Zeekr and designed for driverless service (multi-source).
- Tier 3: the Hyundai–Waymo order talks (per Chapter 1).
- Inference-grade (flagged in text): the AR-threshold mapping of the four exits; the endgame-matrix assignments (AR grades are published measurements; endgame membership is forward projection); “capital markets vote before consumers”; the “China exception”; the ≈5-year switch window (per Chapter 2).
- Utilization (~5% vs 50%+), mileage, and scrappage ranges are industry-standard estimates, noted as such.
Chapter 4
- Tier 1 (official/published research): Waymo’s Feb 2026 round and valuation (multi-source official basis; see Ch. 1); Alphabet Other Bets FY2025 operating loss (~$5.5B, earnings basis); Waymo’s $30 membership (official, Jun 2026); D2 Chapter 6 data-loop scales (Li Auto / Huawei / BYD).
- Tier 1 (supplementary, Jul 22, 2026): Tesla Q2 2026 Update outlook (allocation between “sale to customers” and “owned and operated fleet”; hardware profits accompanied by acceleration of AI/software/fleet profits).
- Tier 1/2 (the §4.4 JV note): Momenta’s customer list (incl. SAIC-VW, GAC-Toyota, Dongfeng Nissan, Mercedes, BMW, Audi, Hyundai), 1M+ vehicles, 68 production models, 64.5% urban-L2 global share (Frost & Sullivan via Caixin), HKEX listing Jul 8, 2026 (multi-source, Tier 1/2); BMW–Momenta China iX3 2026 production and Neue Klasse extension (official statements); Mercedes China CLA with Momenta urban navigation, Feb 2026 MOU upgrade, new S-Class at Auto China 2026 (official and show reporting); VW–XPeng CEA architecture and CARIZON (Horizon JV) as publicly confirmed; U.S. Commerce connected-vehicle final rule (Jan 2025: software MY2027 / hardware MY2030); mainstream JV brands’ China retail share (2020 peak ~60% → 27.5% in 2024 → ~24.9% in Q1 2026; CPCA and multi-source, Tier 2, verified).
- Tier 2 (reliable secondary/independent analysis): German big-three market caps (Yahoo Finance, mid-July 2026: VW ≈ €37B, BMW ≈ €35B, Mercedes ≈ €43B; FX conversion band is this article’s calculation); Obi fare study ($17.25 median, end-2025); ~46% California deadheading (third-party analysis of CPUC data, 29-month basis); FutureSearch FY2026 Other Bets loss forecast (median ~$8.5B); Bloomberg membership break-even math.
- Inference-grade (flagged in text): the $0.9–1.0B annualization of one million weekly trips (fare × 52 rough math, excluding non-fare revenue); the “two-to-three Driver ecosystems” concentration call; the “depot networks nearly unclaimed” observation; “architecture debt borrowed against the bloc”; §4.4’s “split brain” characterization, “most exposed cohort” call, and “architectural sovereignty” as the single JV criterion.
Chapter 5
- Carried-forward verified facts: validation-share reference (Chapter 2’s inference-grade call); the proof obligation penetrating the reasoning layer (Deep Dive 2026-07’s verified IQ10 spec); Figure 3.1’s coordinate system (D2 Appendix A.2).
- Tier 2 (industry observation): agentic AI’s landing in R&D documentation/testing/compliance as a general trend description, pointing at no specific product; “fleet-grade OTA teams countable on one hand” as qualitative observation.
- Inference-grade (flagged in text): the riser/faller lists and the “engineering that serves the driver exits with him” summary; the “middle layer most fragile” organizational call; the R&D political-position projection; §5.4’s “bilingual” requirement and “personal leverage = moving the employer’s dot rightward”; all of §5.5 (transferability ranking and combination priorities).
- This chapter constitutes no individual career-guidance commitment; rankings and combinations are population-level structural judgments.
Chapter 6
- Carried-forward verified facts: the Waymo-vs-German-big-three reconciliation (Chapter 4, mid-July 2026); FutureSearch’s “modestly overvalued” read (Tier 2); Cruise’s shutdown and spending (Chapter 3 basis); Momenta’s Jul 8, 2026 listing (verified in Chapter 4); the Swiss Re study (Chapter 1 basis).
- Tier 1 (published research, self-citation): D4’s AI²-ML benchmark of 12 toolchain subjects, the “generation (D3) decoupled from reasoning autonomy (D4)” finding, SCADE as the set’s only L3 (Working Paper 2026-04); D2’s dual-time-dimension method.
- Inference-grade (the chapter throughout): all seven links’ structural calls, concentration expectations, winner traits, and risk identifications; the pressure-side identification; the ”≈ five-year window” per Chapters 2–3; §6.3’s due-diligence-checklist applicability claim.
- Compliance note: this chapter is industrial-structure analysis and constitutes no investment advice or securities recommendation of any kind; no tickers, timing, or position sizes are recommended. Link 4 adjoins the research team’s commercial neighborhood; treatment is noted in the text.
Chapter 7
- This chapter is the article’s conclusion; all facts follow Chapters 1–6’s verified basis, with no new facts introduced.
- The “direction/range/suspension” structure of the three judgments honors Chapter 1’s methodological commitment; the revision triggers are the Writing track’s (revisable-observation) enforcement mechanism, with thresholds set as this article’s own inference-grade standards.
- “Narrower by half” is an inference-grade rhetorical judgment with no quantitative basis, flagged as such.
A revisable observation, not a locked claim — its revision triggers are stated within. Not investment advice.