archi-intelligence · Research Series

Architecture Intelligence Index

Automotive · 2026 Annual Edition

A versioned, recomputable ranking of 22 global automakers on E/E architecture maturity — measured today (Snapshot) and against confirmed public roadmaps (Roadmap).

22 OEMs · 5 regions Snapshot as of 2026-01-31 Roadmap window to 2027-07 Working Paper 2026-02 · Read Working Paper 2026-02 → Also: Vehicle OS ranking ↓

The AI² Research Series (D1–D3) is published in English only.

Institutional supporters, if any, are marked † and listed below. Support has no influence on scoring or methodology. Currently: none.

Time view
Metric
Region

Methodology. Five-dimension equal-weight scoring (Centralization · SW/HW decoupling · OTA maturity · Functional safety · Compute concentration), fully recomputable from public Tier 1–5 evidence — see Working Paper 2026-02, Appendix A. Roadmap scores reflect confirmed public roadmaps only and carry a delivery-risk rating.

Institutional supporters. Organisations that support archi-intelligence and are also rated in this Index are marked † at their row and named in the standing disclosure above. Support buys no score, no ranking, no change to methodology, and no advance sight of results. Current institutional supporters rated here: none.


Published annually. The Index is a versioned snapshot tied to a citable working paper — it does not drift between editions. Data updates only with a new annual edition. © 2026 archi-intelligence Research Team · CC-BY 4.0 · Next edition: 2027. · DOI 10.5281/zenodo.20513865 · Independence statement

Vehicle OS Capability · VOCM

Vehicle OS Ranking

15 carmakers · initial assessment · data as of 2026-10-03

The Vehicle OS Capability Matrix (VOCM) scores the vehicle-wide software control plane — contract, orchestration and lifecycle — not the E/E hardware. Six dimensions, 0–5 each, max 30; D2’s AR snapshot total (/25) is shown alongside for comparison.

Initial assessment, revisable. This list comes from Deep Dive 2026-09 and is not part of the annual Index above, which is tied to a citable working paper and does not drift between editions. This list is updated as evidence arrives, with changes flagged in the article. Confidence H / M / L reflects strength of evidence.

# Carmaker VOCM /30 V1–V6 Conf. AR /25
=1 Tesla 23 533354 M 23
=1 Huawei HIMA 23 443444 L 22
3 Li Auto 22 443443 M 19
=4 NIO 21 434343 M 20
=4 XPeng 21 433344 L 20
=4 Xiaomi 21 433443 L 19
=4 Leapmotor 21 443343 L —
=8 Mercedes-Benz (MB.OS) 20 433343 M 17
=8 Volkswagen Group (CEA) 20 433343 L 13
10 Rivian 18 433242 L 19
11 BYD 17 332333 L 17
12 BMW (Neue Klasse) 15 332232 L 15
13 GM 13 222232 L 13
=14 Toyota (Arene) 11 221321 M 14
=14 Hyundai (Pleos) 11 121322 M 12

USAChina (New)China (Legacy)EuropeJapan/Korea Hatched = low confidence

  • Leapmotor is not in D2’s 22-carmaker sample, so it has no AR score.
  • Volkswagen Group is scored on its China CEA architecture; where public information is thin, dimensions reference same-lineage XPeng (see 5.4 and Appendix B of the article).
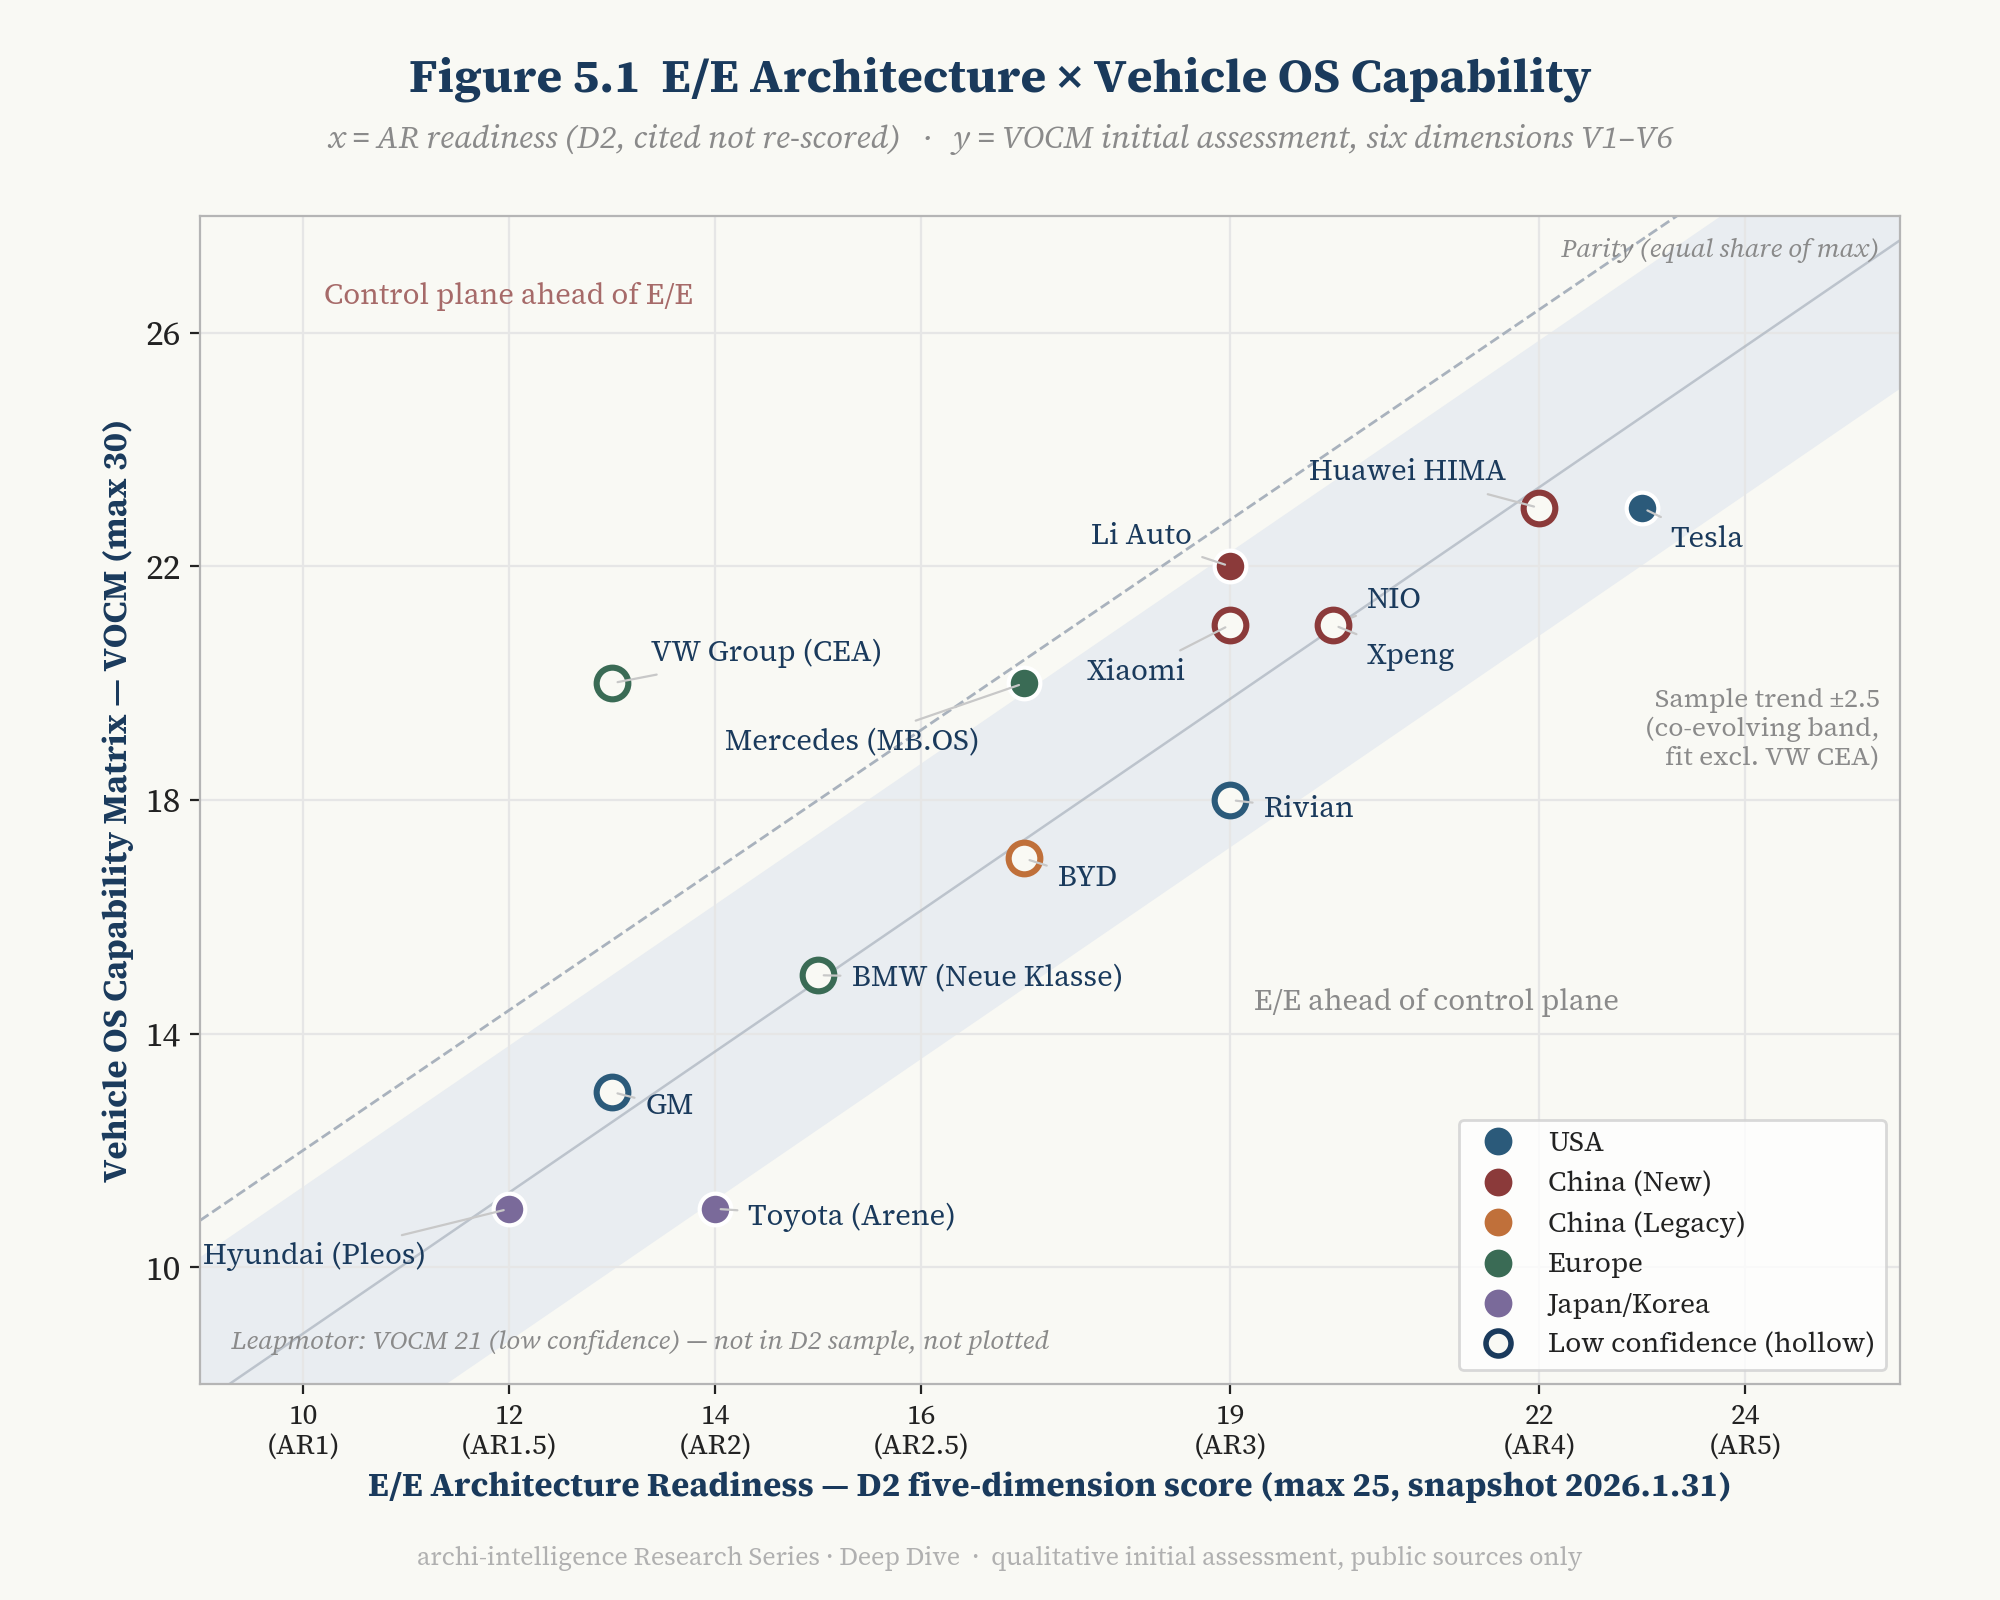
E/E × vehicle OS: has the control plane kept up with the architecture?

x: D2 AR snapshot total (/25); y: VOCM (/30). Dashed line = parity diagonal; shaded band = sample trend ±2.5. Hollow points = low confidence.